 Dmitri Lysenko

⬤ XAU/USD gold has fallen back into decline after its previous bounce fizzled out, with price sliding underneath resistance on the hourly timeframe. The chart shows repeated pushback from the moving average resistance band and a horizontal supply zone, followed by strong downward candles. This pattern reveals fresh selling pressure rather than any real stabilization. The structure stays mostly sideways but keeps developing inside a wider downtrend.
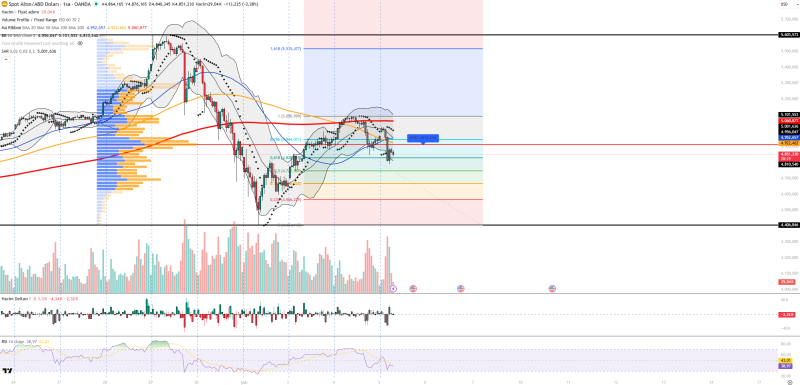
⬤ Momentum indicators back up the weakening market strength. The Relative Strength Index sits near 39, showing weak momentum and getting close to oversold territory. Trading volume picked up during the drop, suggesting active sellers are driving the move lower, while volume delta stays negative—meaning sell-side dominance. Bollinger Bands are tilting toward the lower band, confirming sustained pressure, and the Parabolic SAR remains above price, reinforcing the short-term bearish setup visible on the chart.
⬤ The volume profile points to an equilibrium zone around $4,912, where price has consistently stayed below during this latest decline. Immediate resistance levels sit near $4,922 and $4,956, with higher barriers at $5,060 and $5,101. Support levels appear around $4,851 and $4,810, with deeper levels marked near $4,406 and $4,275. Gold's inability to push back above resistance and the appearance of sharp candles without lower wicks highlight continued selling interest within the current downward structure.

⬤ This matters because gold often reacts to shifts in currency strength and rate expectations. The recent drop in XAU/USD gold lines up with stronger dollar conditions and softer safe-haven demand. Continued trading below the equilibrium area may keep pressure on price, while any bounce near support zones could shape short-term volatility and broader market sentiment.
 Dmitri Lysenko


