
⬤ Gold took a sharp dive after losing momentum above the $5,600 mark. The chart shows gold reversing from recent record territory and accelerating downward into the mid-$4,500s. The selloff brought price back to the December 2025 highs—a critical former breakout zone that's now being retested.
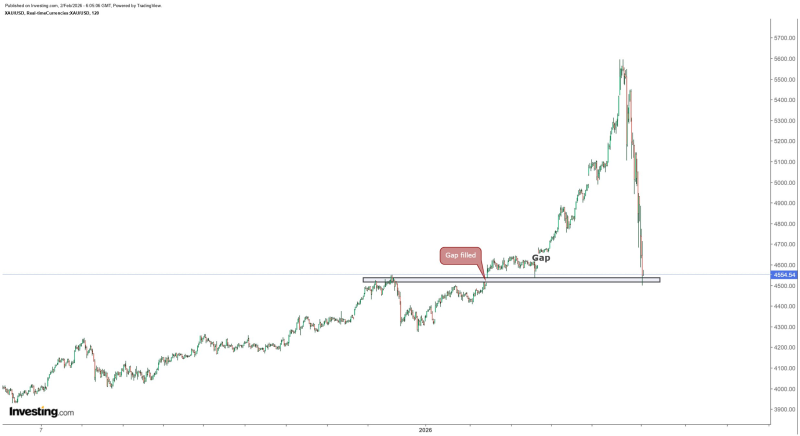
⬤ The chart shows a clear price gap that formed when gold initially surged higher. That gap, created as price broke above previous resistance, has now been completely filled following this latest drop. Gold moved through key levels quickly before finding support near $4,550, which lines up with the upper edge of the former consolidation range. The horizontal support zone on the chart marks just how important this level is technically.
⬤ Even with how fast and steep the pullback was, the price structure doesn't show a full breakdown below the prior highs yet. Instead, this looks more like a retracement back into a zone that hadn't been tested during the earlier rally. The sharp move down reflects high volatility rather than a long-term shift in trend, with price now stabilizing at a well-defined technical level.
⬤ This matters because gold tends to make big moves when momentum-driven rallies reverse. Filling the gap near the December 2025 highs at $4,550 creates a key technical checkpoint for XAU. How gold responds around this reclaimed support zone could shape near-term volatility and direction for precious metals after this fast reversal.


