
⬤ Here's the thing—gold just pumped hard and now it's catching its breath near the $5,000 psychological level. XAU/USD is basically stuck in neutral on the 1-hour chart after that explosive rally. When price gets close to big round numbers like $5,000, it usually doesn't just blast through immediately. Markets need time to digest the move, and that's exactly what we're seeing right now. This isn't a reversal signal—it's more like the market hitting the reset button.
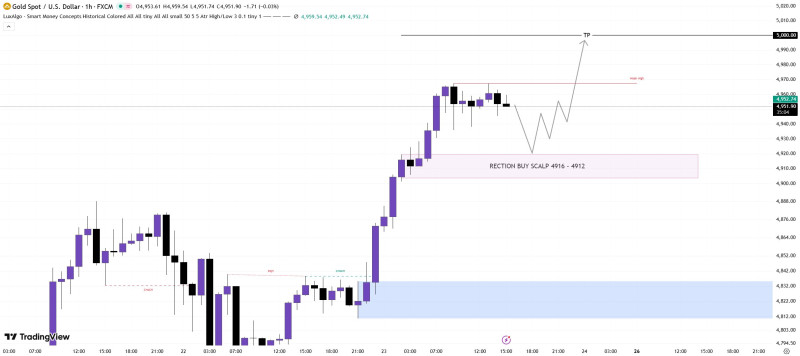
⬤ The chart tells a pretty clear story: gold rocketed up from the demand zone around 4,820–4,830, then started chopping sideways just below 4,960. The candles are getting messy and overlapping, which means momentum's cooled off for now. There's a weak high marked on the chart, showing buyers aren't pushing as hard anymore. But sellers haven't taken control either—it's just a standoff.
⬤ Smart money isn't chasing price up here. Instead, traders are watching for dips into better entry zones. The chart highlights a correction buy scalp zone between 4,916 and 4,912 where buyers showed up before. If this consolidation stretches out, there's a deeper pullback area marked between 4,900 and 4,885 that could attract more interest. The likely scenario? More sideways action or a measured dip before gold makes another push higher.
⬤ This consolidation phase matters because it shows how gold typically acts near major levels. Trading below $5,000 doesn't mean the trend's broken—it just means the market's finding balance. If those support zones keep holding up, the bigger picture still looks solid once this sideways grind wraps up.


