 Dmitri Lysenko

⬤ Gold extended its pullback early in the week, with XAU/USD dropping to an intraday low near $4,584 before showing signs of stabilization. The move came after a sharp rejection from late-January highs around $5,600, confirming this is a corrective phase rather than a full trend reversal. The hourly chart shows heavy selling pressure into the lower support zone, where price action has started to slow down.
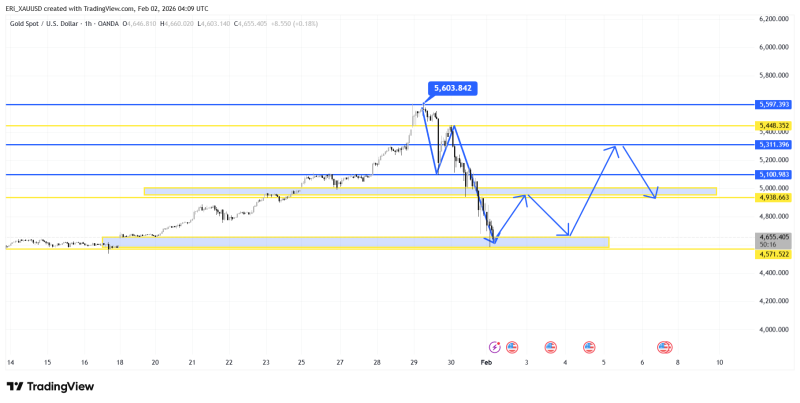
⬤ The latest downside move matched previously projected correction targets. The chart shows gold testing a critical demand zone between roughly $4,550 and $4,580—an area that's acted as support during earlier consolidation periods. How the market responds here suggests downside momentum may be losing steam after failing to hold above the $5,300–$5,400 resistance band.
⬤ The decline kicked off after gold briefly peaked near $5,603 before reversing hard. What followed was a series of lower highs and lower lows, typical of a corrective leg within a bigger bullish picture. XAU/USD looks set to trade between $4,500 and $5,000 for now. If prices revisit the $4,550–$4,580 zone in the short term, a bounce toward $4,650–$4,700 is the first upside target, with higher levels near $4,900–$5,000 coming into play once consolidation runs its course.
⬤ This phase matters because it reinforces the consolidation theme after an extended rally. Holding above $4,500 keeps the broader bullish outlook intact while limiting the risk of a deeper drop. At the same time, the well-defined trading range shows continued uncertainty, with upcoming economic data likely to determine whether gold pushes higher or stays stuck in sideways action.
 Dmitri Lysenko


