
⬤ GBP/USD made a strong push higher on the 4-hour chart, gaining speed after wrapping up a correction and confirming the bulls were back in control. The pair bounced from around 1.34 before breaking upward and stretching toward the 1.37 to 1.38 zone. This move lined up perfectly with a weaker US dollar, which gave the setup extra fuel.
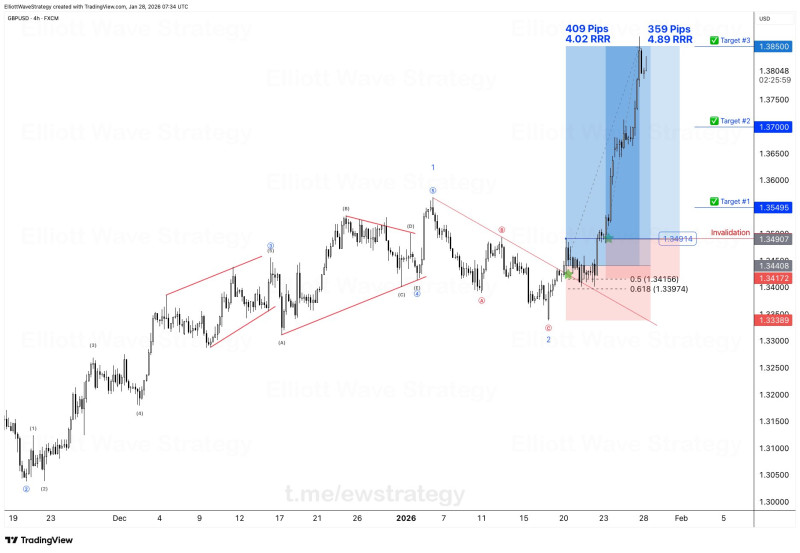
⬤ The chart shows a textbook corrective pattern followed by a clean impulse wave that fits Elliott Wave theory. After holding above key Fibonacci levels near 1.34, GBP/USD picked up steam and pushed through resistance. Price climbed toward marked targets—first around 1.355, then 1.370, before reaching the higher zone near 1.385. This wasn't just a quick bounce; it was sustained directional movement.
⬤ The chart clearly maps out risk levels, with the bullish setup staying intact as long as price holds above the invalidation zone around mid-1.34. Once the breakout confirmed, the measured move showed significant pip expansion backed by strong bullish candles and minimal pullbacks.
⬤ This matters because GBP/USD is showing how structured patterns can trigger fast moves when technical setups and macro conditions click together. How the pair behaves after hitting these targets will tell us whether we're heading into consolidation or if the bulls still have room to run.


