 Dmitri Lysenko

⬤ GBP/USD has been climbing steadily, showing a clear impulsive pattern on the hourly chart. The pair's been trading within a strong upward Elliott Wave sequence since mid-January, with price action staying well above key technical support levels. This setup suggests the broader uptrend still has room to run.
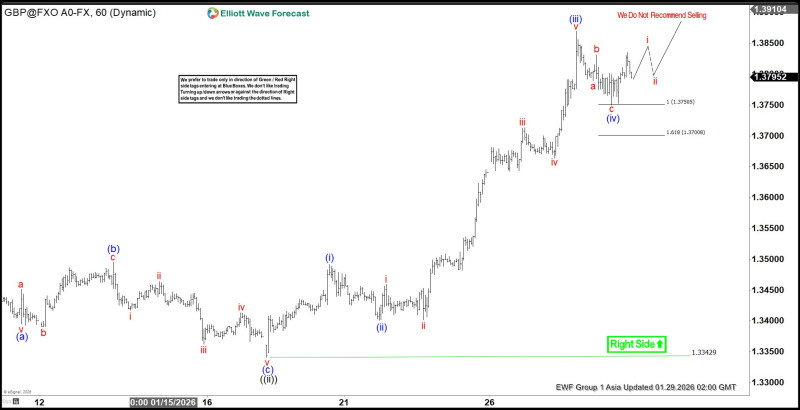
⬤ The chart shows a textbook series of higher highs and higher lows—classic signs of an impulsive Elliott Wave rather than just a corrective bounce. After the sharp rally, GBP/USD shifted into consolidation mode around the 1.3750 area. This sideways action looks like a pause within the larger upward move, not a signal that the trend's reversing.
⬤ Wave projections are targeting 1.39 as the next upside level, with room for more gains if the impulsive structure holds together. Fibonacci levels on the chart back this up, showing that any pullbacks should stay corrective as long as price holds above the support zone. The overall structure favors more upside while those key levels stay intact.
⬤ This impulsive move matters because it confirms the bullish momentum within the current technical framework. If GBP/USD keeps pushing toward and past 1.39, it would validate the Elliott Wave outlook and strengthen trend-following sentiment. The well-defined wave structure and support levels also give traders clear reference points for gauging trend strength and managing risk as the pair moves forward.
 Dmitri Lysenko


