 Dmitri Lysenko
⬤ GBP/USD is holding steady after punching through descending channel resistance, and the four-hour chart's looking pretty solid. Instead of rolling over like you'd sometimes see after a breakout, price is actually respecting that former resistance zone and staying above it. The pound's stabilizing nicely against the dollar after that strong push higher.
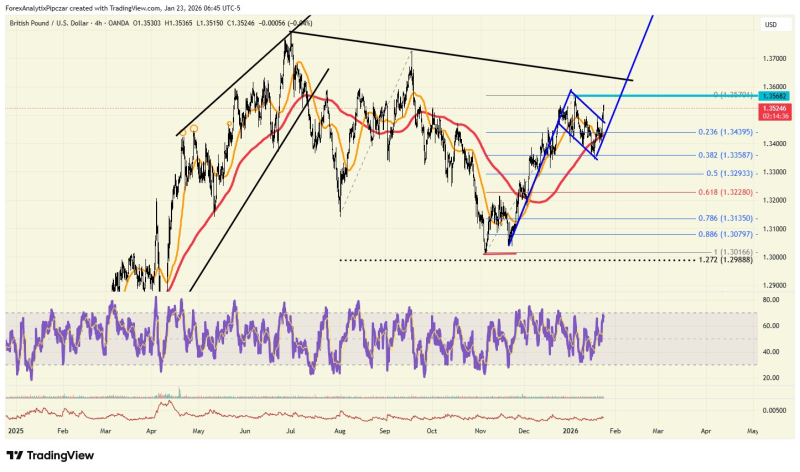
⬤ Here's what's happening on the chart: GBP/USD bounced hard from those late-2025 lows around 1.30, then put in a clean sequence of higher highs and higher lows into early 2026. After the breakout, we're seeing a tight consolidation—basically a bull flag forming instead of any real pullback. What's interesting is this consolidation's sitting right above key Fibonacci levels at 0.382 and 0.236, which usually hold up as support when a trend's got legs.
⬤ The level everyone's watching now is 1.3570. That's your next resistance zone, and if price can push through and hold above it, you're looking at confirmation of that bull flag pattern and more upside to come. The rising trendline from November's still intact, and moving averages keep tracking higher underneath—all supporting that bullish structure.
⬤ Why this matters: GBP/USD moves often signal what's going on across the broader currency market. If the pound keeps this strength above channel resistance, you'll likely see more bullish positioning pile in. A clean break above 1.3570 could shift directional bias across major FX pairs. That said, the consolidation means confirmation's key here—if current levels don't hold, traders will be looking back down toward support within that flag structure.
 Dmitri Lysenko


