
⬤ GBP/USD pushed higher after testing crucial Elliott Wave support around 1.2680-1.2880 on the daily timeframe. The pair bounced right from this blue box zone—a spot traders watch for high-probability reversals using wave analysis. Here's the thing: sellers couldn't push through, which tells you the pullback's probably over.
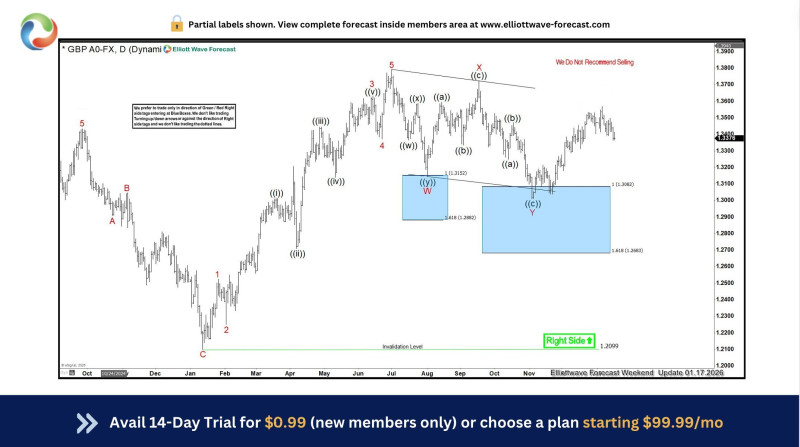
⬤ The chart's showing a completed correction before the turnaround. That 1.2680-1.2880 support zone, mapped out with Fibonacci extensions, became the floor where downside pressure ran out of steam. Price stayed comfortably above the 1.2099 invalidation level, keeping the wave count on track. This kind of behavior screams corrective move, not the start of something bearish.
⬤ Since bouncing, GBP/USD's been looking solid—holding above the low and carving out higher swing points. The recovery's pushed the pair back toward 1.33-1.35, right where you'd expect the next bullish wave leg to aim. The chart even notes "We Do Not Recommend Selling," basically saying downside plays don't make sense while price holds above that support structure.
⬤ This matters for FX traders because GBP/USD often signals shifts in risk appetite and macro themes. When price respects Elliott Wave support like this, it's showing real demand underneath. As long as we're above that invalidation point at 1.2099, the technical setup keeps pointing higher within the current wave pattern.


