 Dmitri Lysenko

⬤ Crude oil futures are holding onto a bullish technical picture right now. Recent price movement suggests there's room for more gains ahead. According to the Group 1 London update, CL_F oil should keep climbing as long as any dips stay above the 55.7 level. The chart backs this up with a rising structure based on Elliott Wave analysis and a clearly marked danger zone where the trend would flip.
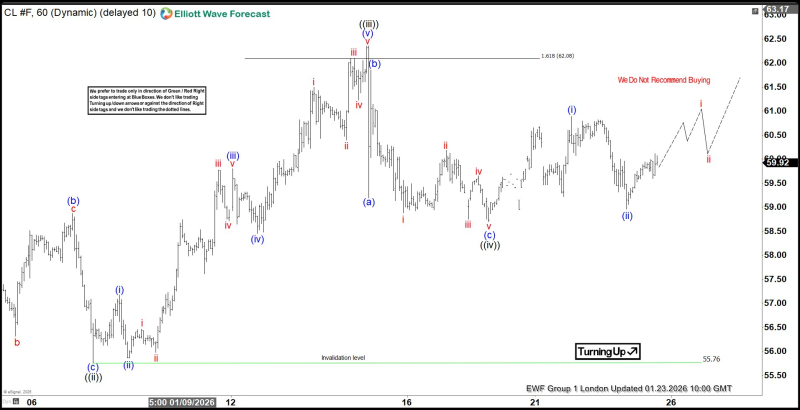
⬤ Here's the thing—the chart shows oil bouncing back from earlier corrections while respecting that ascending support line. Price has been trading near the upper 59 area lately. You're seeing multiple higher lows staying intact, which tells you buyers keep showing up when prices pull back. The wave sequence on display points to consolidation within a bigger uptrend, not a breakdown. That invalidation level sitting near 55.7? That's your line in the sand where the current bullish setup would get called into question.
As long as price holds above the stated support zone, the structure favors continuation rather than reversal, with dips viewed as part of an ongoing trend.
⬤ From a technical angle, the Elliott Wave labels suggest oil's moving through a corrective phase that hasn't messed with the broader upward bias. Nobody's saying chase it at these elevated levels, but downside attempts haven't gained any real traction so far. While price stays above that support zone, the structure's leaning toward continuation, not reversal—pullbacks look like part of the trend.
⬤ This matters for the broader market because crude oil trends ripple through everything—inflation expectations, currency moves, sentiment across energy-linked assets. A sustained push higher in oil prices hits multiple sectors, and that clearly defined support level gives you a solid reference point for managing risk. With CL_F holding above 55.7, the technical picture keeps pointing toward stability and potential upside instead of renewed selling pressure.
 Dmitri Lysenko


