
⬤ Natural gas hit the brakes after a brutal selloff, and now everyone's watching for a potential bear flag pattern. The current structure could be setting up for another leg down, but the pattern isn't confirmed yet. Right now, NATGAS is hovering around $3.21 after dropping hard from late-January highs.
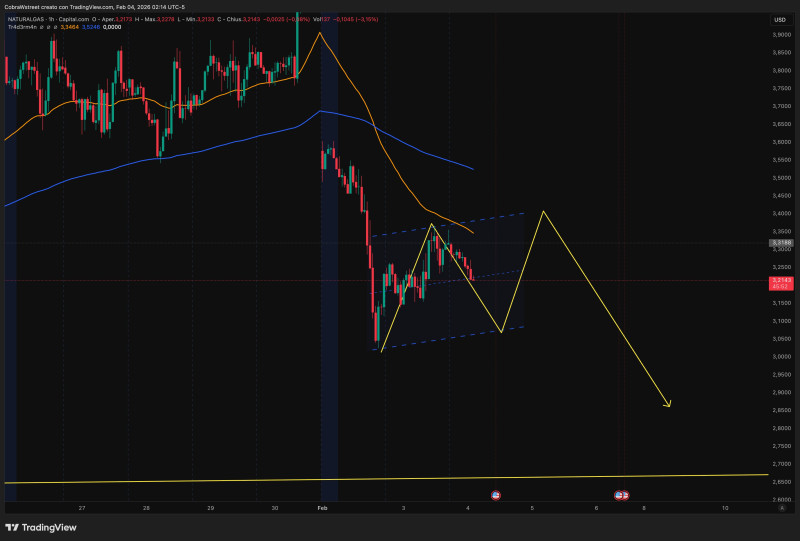
⬤ The hourly chart shows a nasty breakdown that kicked off in early February, slicing through key short-term moving averages like butter. After that drop, price squeezed into a narrow, slightly upward-tilting consolidation box. This is textbook bear flag territory — it's a pause, not a reversal. The range is tight and hasn't challenged any major resistance levels yet.
⬤ The chart hints that NG might creep a bit higher within this consolidation zone before making its next move. That fits with the "wait for it" approach — the top of the range usually shows whether sellers are still in control. The pattern needs more time to play out before anyone can call it.
⬤ Why does this matter? Natural gas loves to rip or dip after consolidating. How price acts in this range will tell us if the downside pressure continues or if we're heading into a bigger stabilization phase. In volatile energy markets like this, jumping the gun can leave you exposed to whipsaws and fake-outs.


