 Ivan Zhigalov
⬤ GAS has hit a critical technical moment after holding firm above a horizontal support zone on the daily chart. The asset is building pressure beneath a descending trendline, setting up what could be a significant breakout. Price is currently trading near the $1.95–$2.00 range after defending this support level multiple times in recent sessions.
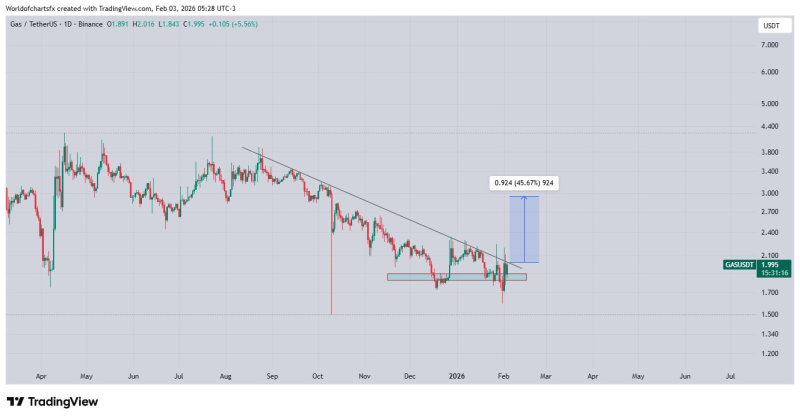
⬤ The chart reveals a persistent downtrend since mid-2025, with lower highs capped by a clear descending trendline. Price action has compressed into a tightening range over recent weeks, showing reduced volatility and weakening downside momentum. This pattern suggests sellers are losing steam while buyers continue stepping in at support.
⬤ A measured move projection points to roughly 40–45% upside potential if GAS breaks above the trendline. This target aligns with price zones seen earlier in the year. The key condition: a clean break above resistance with sustained follow-through.

⬤ Extended consolidation phases like this often precede sharp directional moves. With GAS squeezed between horizontal support and descending resistance, a decision point is approaching fast. How price behaves around this trendline will likely set the tone for near-term momentum and influence sentiment across similar mid-cap digital assets.
 Ivan Zhigalov


