 Dmitri Lysenko

⬤ The USD/CAD pair is showing no signs of life in today's trading, pushing lower even while the US dollar is gaining ground against most other currencies. The pair is stuck in breakdown territory and getting close to the 161% Fibonacci extension sitting at 1.3468. Looking at the four-hour chart, the downward pressure just won't let up—price can't seem to climb back above the support levels it lost during late January's selloff.
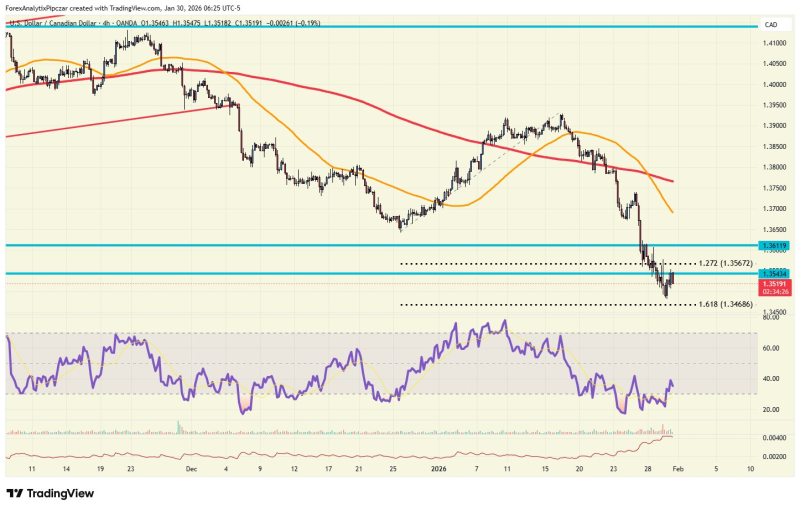
⬤ The chart paints a pretty clear bearish picture right now. USD/CAD is trading beneath its main moving averages and well below previous consolidation zones. After breaking decisively through the 1.36 level, the pair kept dropping and briefly settled around 1.3519 before heading toward that 1.3468 extension target. What's interesting here is that even though the dollar is doing well against other currencies, USD/CAD isn't following suit—that's telling you something about the relative weakness in this pair.
⬤ The momentum picture has shifted but hasn't actually reversed course. The RSI readings shown in the lower panel have bounced back from oversold territory, which means those extreme downside exhaustion signals are gone for now. But here's the thing—this technical cooling-off period might actually set the stage for more downside instead of signaling a real bounce. Price is still sitting below old support areas, keeping the overall intraday bias pointed down.
⬤ Today's setup gets even more interesting with Canadian GDP and US producer price index numbers coming out later. USD/CAD is already trading right near that key 1.3468 Fibonacci extension and stuck in breakdown mode, so these data releases could really shake things up. How the pair reacts around this 1.3468 zone will probably tell us whether this weakness is going to continue or if we're finally going to see some stabilization in the near term.
 Dmitri Lysenko


