⬤ Silver has fallen into aggressive selling mode on the hourly timeframe after what looked like a recovery attempt quickly turned into a trap for buyers. Price tried to stabilize briefly before breaking down hard with large red candles, confirming that the downtrend is still very much in control. What seemed like a potential bounce ended up being a classic bear trap—just enough upside to pull in buyers before the floor gave way and selling took over again.
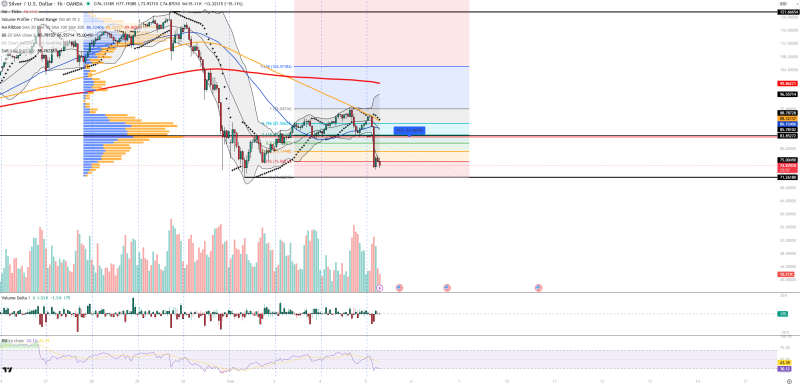
⬤ The technical picture backs up the bearish tone across the board. The Relative Strength Index has dropped close to 30, pushing silver into oversold territory where selling has been overdone in the short term. Volume spiked noticeably during the breakdown, showing panic-driven exits rather than calm distribution. Volume delta turned deeply negative, meaning sellers were far more aggressive than buyers. Bollinger Bands are stretching wider as price pushes below the lower band, a clear sign that volatility is expanding. The Parabolic SAR is still sitting above price, which confirms the bearish structure hasn't shifted.
⬤ Looking at the volume profile, the main balance area sits around $83.45, which is now above where silver is currently trading. Resistance levels are stacked at $83.85, $86.12, $88.78, and $96.55, while support zones appear near $75.04 and $74.87, with deeper levels down at $71.26 and $68.00. The long-bodied candles on the chart show this isn't just noise—it's sustained downward pressure, not a temporary dip. The earlier recovery clearly wasn't a real reversal, just a brief pause before sellers regained control.
⬤ This move matters because silver is highly sensitive to shifts in dollar strength, interest rate expectations, and overall risk sentiment in commodity markets. The recent drop in Silver lines up with a stronger U.S. dollar and broader risk-off positioning across markets. With price now trading below the equilibrium zone and volatility picking up, silver remains vulnerable to macro headwinds and short-term directional swings.


