 Alex Borzak

⬤ Silver has pushed higher after testing a critical support area highlighted on the chart near the upper $28 range. The Elliott Wave pattern shows the metal finished a corrective decline before flipping back to the upside. Buyers stepped in at the projected blue box zone and sparked a reversal that brought momentum back into bullish territory.
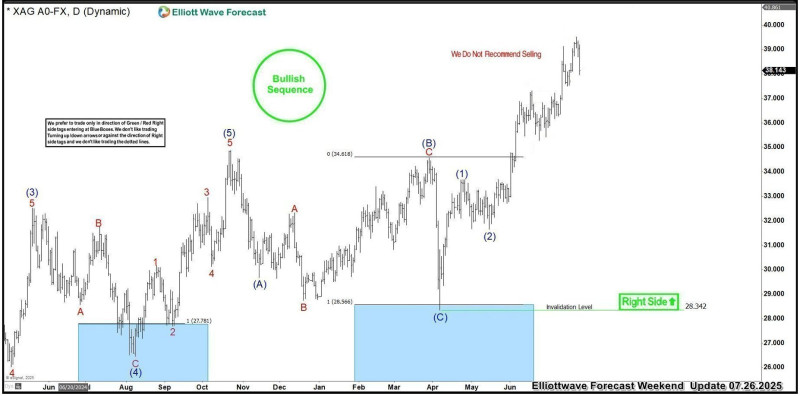
⬤ The broader chart reveals a bullish sequence where previous dips consistently found buying interest near marked support levels. After dropping toward the blue box around $28, price changed direction and started building higher swings. The bounce came right after a corrective wave pattern wrapped up and matched the right-side bullish signal displayed on the chart. Silver then broke above earlier resistance near the mid-$30 area, confirming the strengthening upward drive.
⬤ Wave labeling shows the correction—marked as wave C—completed inside the blue box before the market took off again. The structure then delivered higher highs and higher lows, backing the continuation of the bullish trend. The chart also includes a note warning traders against selling while the current structure holds and the invalidation level near $28.34 stays untouched.
⬤ This move matters because silver often mirrors broader commodity trends and shifts in demand outlook. When price reacts cleanly from a projected support zone, it can shape direction and volatility across precious metals markets. With silver holding its bullish sequence after the rebound from $28, traders are watching closely to see if the uptrend continues as conditions develop.
 Alex Borzak


