
⬤ Silver just experienced a 47% crash from its recent high—the exact same drop that happened after the 2011 peak. The technical comparison shows how XAG fell from a multi-year rally into a sharp correction before finding support at a critical level.
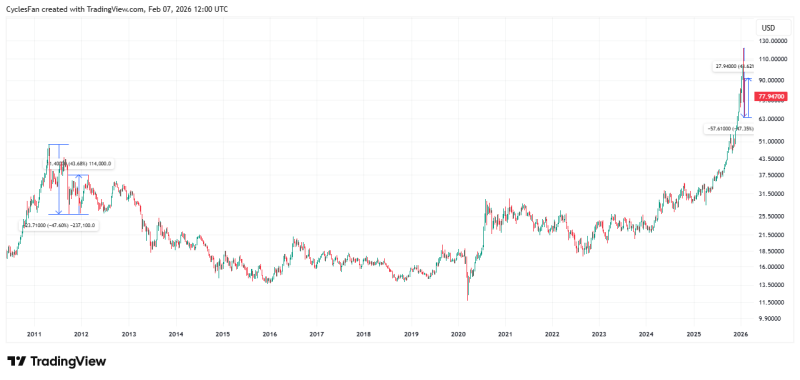
⬤ After the 2011 collapse, silver bounced back hard with a 43% recovery before pulling back again. Right now, XAG is doing something remarkably similar—rebounding aggressively from the bottom and testing higher resistance zones. This isn't about predicting the next week or month, but recognizing the structural rhythm between crashes and recoveries.
⬤ If history repeats, silver could rally toward $88, then drop back to the $64 zone to form a double bottom. From there, XAG might push higher again with a cycle top potentially forming near $92. The pattern points to extended volatility with back-and-forth movement rather than a straight climb.
⬤ What makes this interesting is how silver behaves after major drawdowns—it doesn't just shoot up. Instead, it bounces, pulls back, retests, and builds momentum over time. If the historical comparison holds, XAG could spend months or even years swinging between these key levels before establishing a real long-term peak later this decade.


