 Alex Borzak

⬤ Silver prices took a hit with XAG touching lows near $63.90 on the daily chart after a sharp pullback. The drop came after getting rejected below resistance levels at $92.01 and the higher resistance at $121.78.
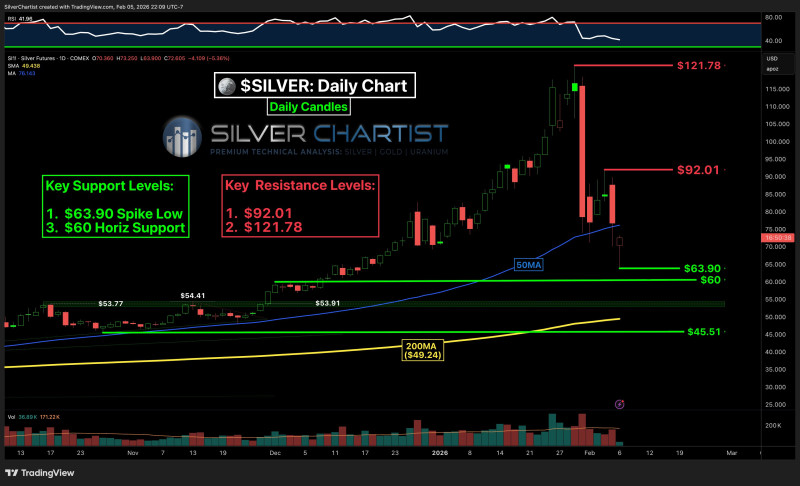
⬤ The chart shows immediate support around $63.90 and horizontal support near $60. Below that sits a stronger long-term support zone between $50 and $54. This decline follows a rapid advance earlier in the trend before selling pressure took over in recent sessions.
⬤ Downside risk is still on the table, though the risk-to-reward setup improved after the recent drop. A move into the $50s is possible but not the main expectation right now. The concentration of support zones below current price marks the next areas where we might see reactions.
⬤ XAG price action shows how reactions near major support levels can shape market direction after a correction. What happens around the $60 to $50–$54 range will determine whether price stabilizes or keeps retracing within the broader structure.
 Alex Borzak


