 Edward Culchenko
⬤ Silver took a nosedive during the latest session, marking one of the steepest drops we've seen in weeks. The four-hour chart shows Silver extending losses after a solid rally, with selling pressure ramping up into early February. The selloff dragged price back to levels from earlier consolidation phases, showing a major shift in short-term momentum.
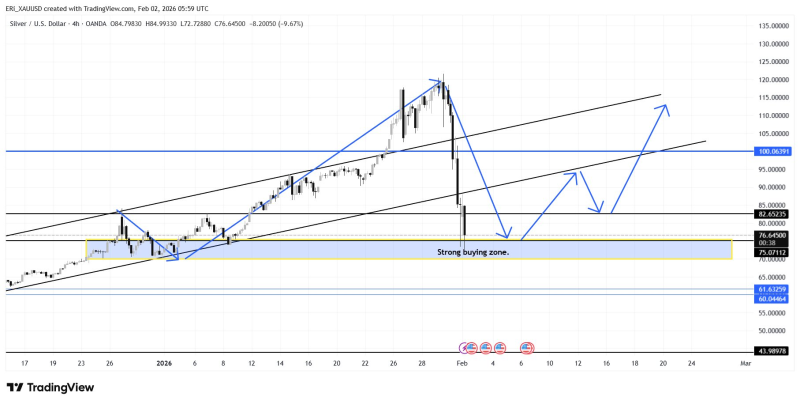
⬤ The chart confirms Silver fell close to 10%, with the low touching $72.60. This came after getting rejected from highs near the upper edge of the rising channel, where price had been trading above $100. Once that channel support broke, sellers piled in and the decline went nearly vertical—wiping out a huge chunk of the prior rally in just a short time.
⬤ Price is now sitting in a well-defined demand zone between $72 and $70, marked on the chart as a strong buying area. This zone lines up with previous consolidation and reaction points from earlier in the trend. The structure shows this area has pulled in buyers before, making how price acts here really important. Even with volatility still running high, this $72–$70 range could be where longer-term buyers start stepping in.

⬤ This matters because Silver tends to make exaggerated moves when momentum shifts fast. If price can hold above the $72–$70 support zone, it could stabilize things after this sharp drop. But if this level fails, downside risk increases and we'd be looking at a deeper pullback. With XAG trading right in this critical support band, the big question is whether there's enough demand to absorb the recent selling.
 Edward Culchenko


