 Dmitri Lysenko

⬤ Copper is currently stabilizing near a major historical support zone that's held firm across multiple market cycles. The long-term chart reveals price action finding its footing after a prolonged decline, maintaining position above a multi-year base while momentum indicators show early signs of recovery.
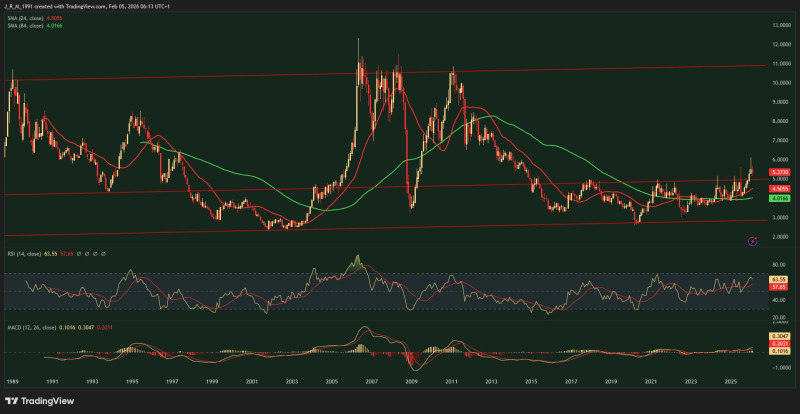
⬤ The chart structure reveals repeated bounces from this same support area throughout previous cycles, creating a well-established floor. Moving averages have flattened out as price hovers nearby, signaling the market has shifted into pause mode rather than continuing its downward trajectory. When adjusted for M2 money supply, copper appears historically compressed relative to broader liquidity conditions.
⬤ What we're seeing now is classic consolidation—price isn't breaking lower but instead trading within a defined range. This suggests buyers and sellers have reached a temporary standoff. The market is essentially catching its breath after the previous leg down, neither committing to further weakness nor launching higher yet.
⬤ If this support zone continues holding, the technical setup favors another upward leg in copper's broader cycle. Right now, the market appears to be in that crucial transition phase where either accumulation or stabilization takes place before determining the next directional move.
 Dmitri Lysenko


