 Nataly Kambur

⬤ Copper hit the lower edge of its rising broadening wedge and formed a bullish hammer candle on the daily chart. Sellers tried pushing it down during the session, but buyers stepped in, absorbed all that selling pressure, and drove the price right back up toward the top of the candle's range. This happened right at the ascending support line that's been holding up the entire uptrend.
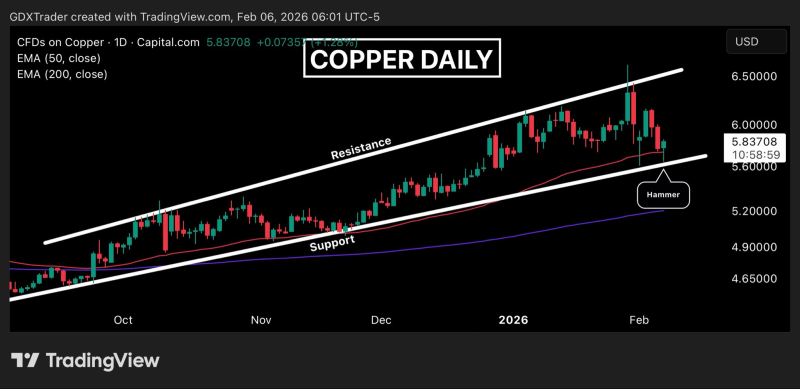
⬤ That hammer pattern shows sellers got rejected hard when they tried taking price lower. More importantly, there was zero follow-through on the bearish side at what should've been a critical demand zone. The bounce got even more interesting when copper reclaimed the 50-day exponential moving average—basically confirming that the recent downside momentum has stabilized after the pullback.
Sellers pushed price lower during the session but buyers absorbed supply and lifted the market back toward the upper portion of the candle's range.
⬤ What's happening here is pretty clear: dip buyers are active. They defended that trend-defining support while sellers completely failed to hold price below it. Now that we're back above the 50-day EMA, this recent weakness looks more like a normal correction inside the bigger structure than the beginning of any real trend reversal.
⬤ Here's why this matters: copper's entire structure depends on that ascending support and the 50-day EMA holding. As long as these levels keep holding, the broader uptrend stays intact. Break below them for real though, and we're looking at a deeper correction starting to unfold.
 Nataly Kambur


