⬤ USD/JPY turned into a wild ride after the Bank of Japan kept rates on hold. What really got traders buzzing was Governor Kazuo Ueda's comments—they weren't as hawkish as some expected. The pair shot back toward 159, dangerously close to January's high. The daily chart shows price bouncing off earlier dips and hanging around rising moving averages, proving just how jumpy this pair is right now.
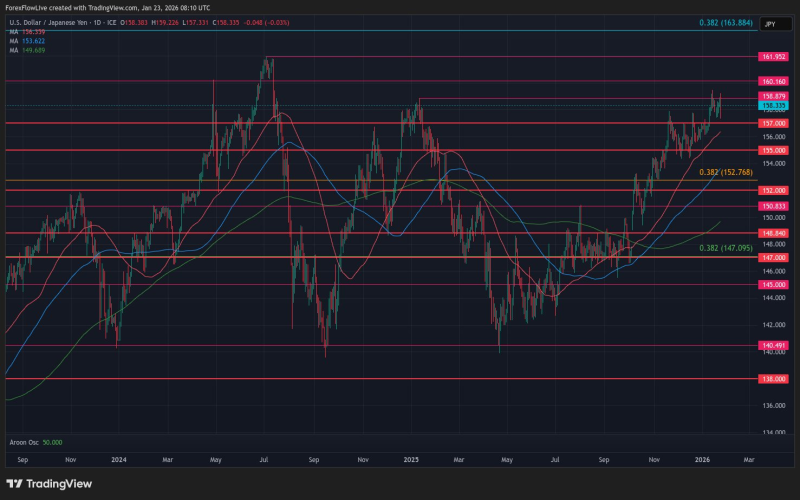
⬤ Then things got crazy. A massive sell order—or what looked like a "rate check" from authorities—sent USD/JPY tumbling nearly 200 pips in minutes. The pair crashed to 157.37 before bargain hunters jumped in near the 157 level, pushing it back toward 158. Before the drop, USD/JPY had been cruising above 158.85–158.90, looking ready to test January's peak.
⬤ Here's what matters now: 160 is the big line in the sand. That's where intervention kicked off last year, and it's still haunting traders. Above that, you've got the July 2024 high and 161.95—both levels where authorities stepped in before. There's also 163.88, a long-term Fibonacci level going back to 1975, sitting there as serious resistance.


