
⬤ CHF/JPY slowed down after pulling back into a highlighted support region on the hourly chart. The decline reached what traders call the "blue box area"—a zone typically linked to corrective completions in Elliott Wave setups. This came after choppy movement near recent highs where upside momentum had already started fading.
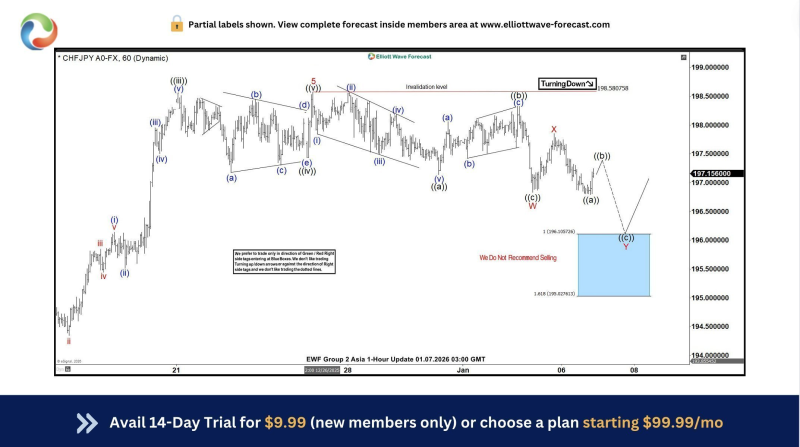
⬤ The pair previously traded around 198.50 before turning lower in what looked like a corrective move rather than a full breakdown. The pullback extended into the projected blue box between roughly 196.10 and 195.03, where Fibonacci levels overlap. Price stabilized in this zone as expected, behaving like a corrective wave finding its floor rather than a trend reversal.
⬤ The broader Elliott Wave picture shows this pullback fits within a larger bullish structure. Earlier rallies were marked as impulsive waves, while the recent drop was mapped as a correction nearing its end. The invalidation level sits near 198.58, meaning the overall bullish framework hasn't been broken. The analysis warned against selling into the support zone, pointing to unfavorable risk-reward once price entered the reaction area.

⬤ This pullback matters because it shows how technical levels based on wave structure and Fibonacci measurements can shape short-term price behavior. Reactions from these zones often influence near-term sentiment and where liquidity flows, especially in active forex pairs. While volatility stays elevated, CHF/JPY's ability to hold after hitting the blue box reinforces how structured technical frameworks help assess corrective moves within larger trends.


