 Nataly Kambur

⬤ The SPDR S&P 500 ETF Trust shot higher after hitting support in a well-defined blue box area on the 1-hour chart. The bounce came after a corrective pullback within the larger uptrend and showed a strong response from that demand zone. Long positions entered near support have now moved into risk-free territory as price climbed higher.
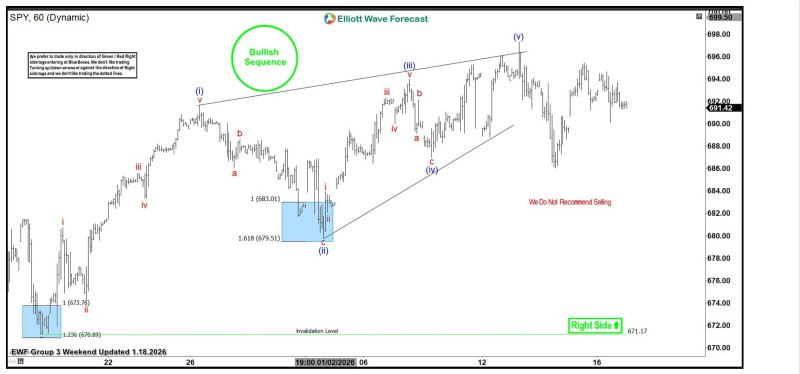
⬤ The chart shows a bullish Elliott Wave pattern with higher highs and higher lows inside an upward-sloping channel. The recent dip played out as a correction rather than a real selloff before reversing from the blue box support. This reaction proved that selling pressure got absorbed at a key technical spot, keeping the bigger structure alive. Price has stayed well above the invalidation level near 671, which keeps the bullish outlook solid on the intraday timeframe.
⬤ After the bounce, SPY kept trading inside the rising channel, with price action pointing toward continuation instead of distribution. The Elliott Wave setup suggests the market is moving through later stages of the bullish sequence, while pullbacks are just corrective pauses. The analysis makes it clear that the trend stays bullish as long as key structural levels hold.
⬤ This price action matters for the broader market because SPY tracks overall US equity performance. A strong bounce from a clearly marked support zone backs up confidence in the trend and shows how corrections can resolve without breaking momentum. As long as SPY holds above its invalidation level and respects the bullish structure, short-term sentiment lines up with trend continuation rather than reversal.
 Nataly Kambur


