 Edward Culchenko

⬤ The Dollar Index just made a move into what traders call an "extreme zone"—basically an area where the rally runs out of gas. Price pushed up toward the 99.20–99.40 region and immediately got rejected. The chart shows that's exactly where selling pressure was expected to show up, and it did.
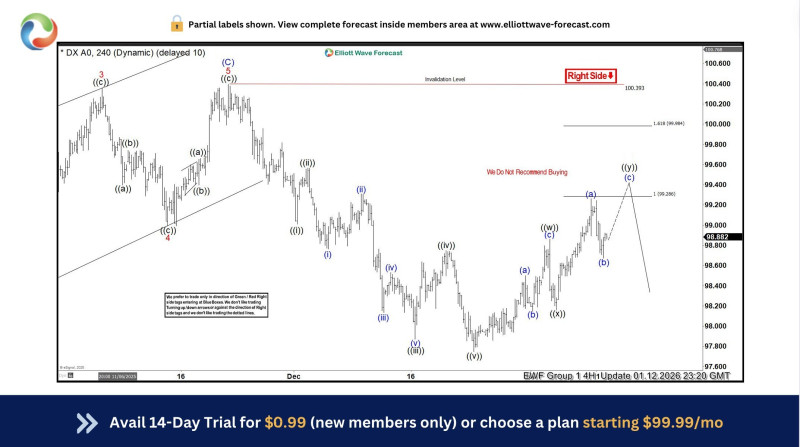
⬤ The structure behind this move looks messy—lots of overlapping waves that don't have the clean, strong characteristics you'd see in a real trend. The Elliott Wave count suggests this whole bounce was corrective, meaning it's just a pause in the bigger downtrend. There's an invalidation level sitting at 100.39—if DXY breaks above that, the bearish setup breaks down.
⬤ After testing that resistance zone, the index rolled over hard. You can see it clearly on the right side of the chart—price couldn't hold, sellers stepped in, and the bounce died. That's classic behavior when a correction finishes and the main trend tries to reassert itself.
⬤ Why does this matter? Because when the dollar moves, everything else feels it. Currency pairs react, commodities shift, and global liquidity gets affected. A rejection from resistance like this creates volatility across forex markets and impacts anything priced in dollars. As long as DXY stays under 100.39, the technical picture still points to corrective action—not a confirmed reversal.
 Edward Culchenko


