 Dmitri Lysenko
⬤ SPY is hanging around a pretty important technical spot after printing a weekly indecision candle near recent highs. Price is sitting around $690 after getting rejected from the upper level near $697.84. The weekly low has become a level worth watching after that doji-type structure showed up, signaling some hesitation in the momentum.
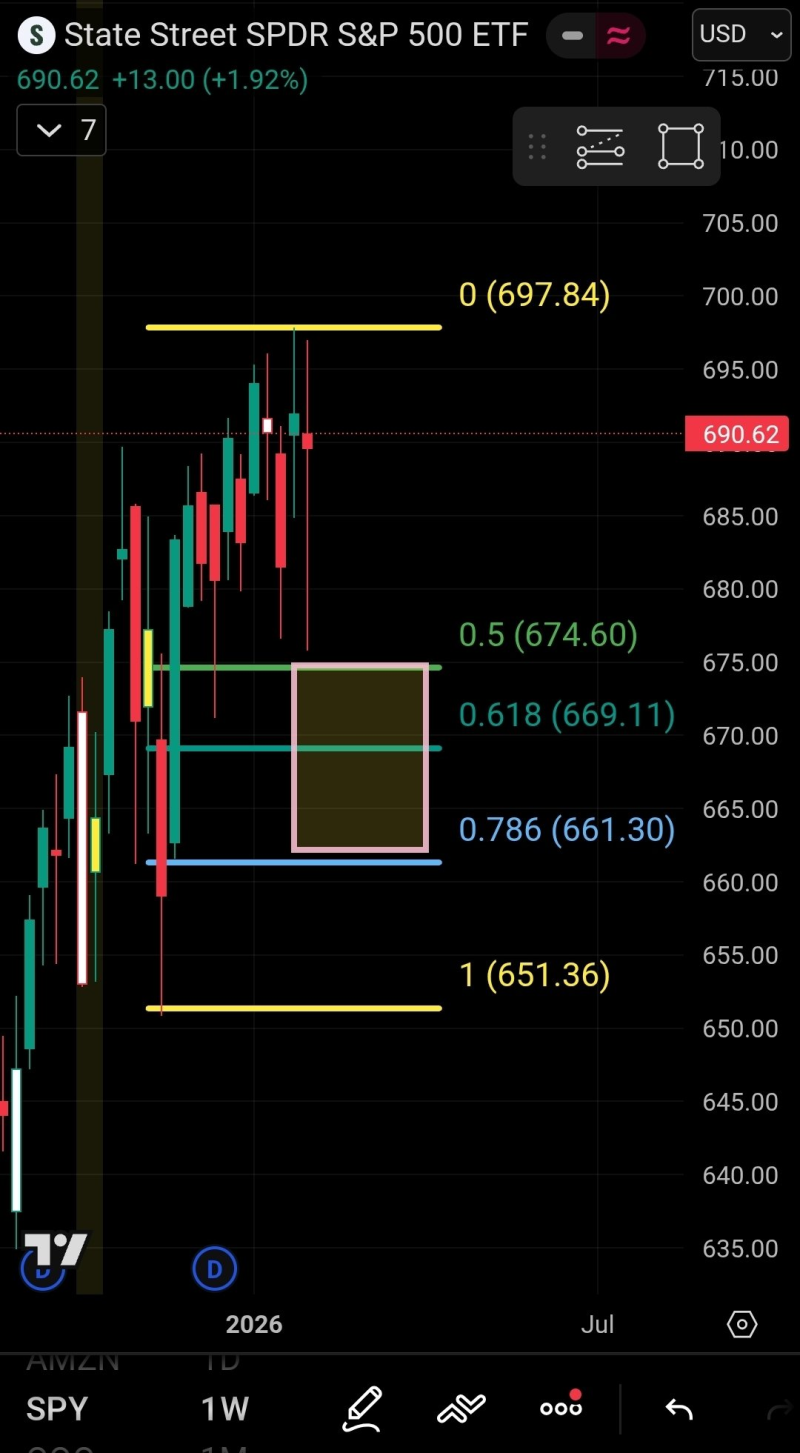
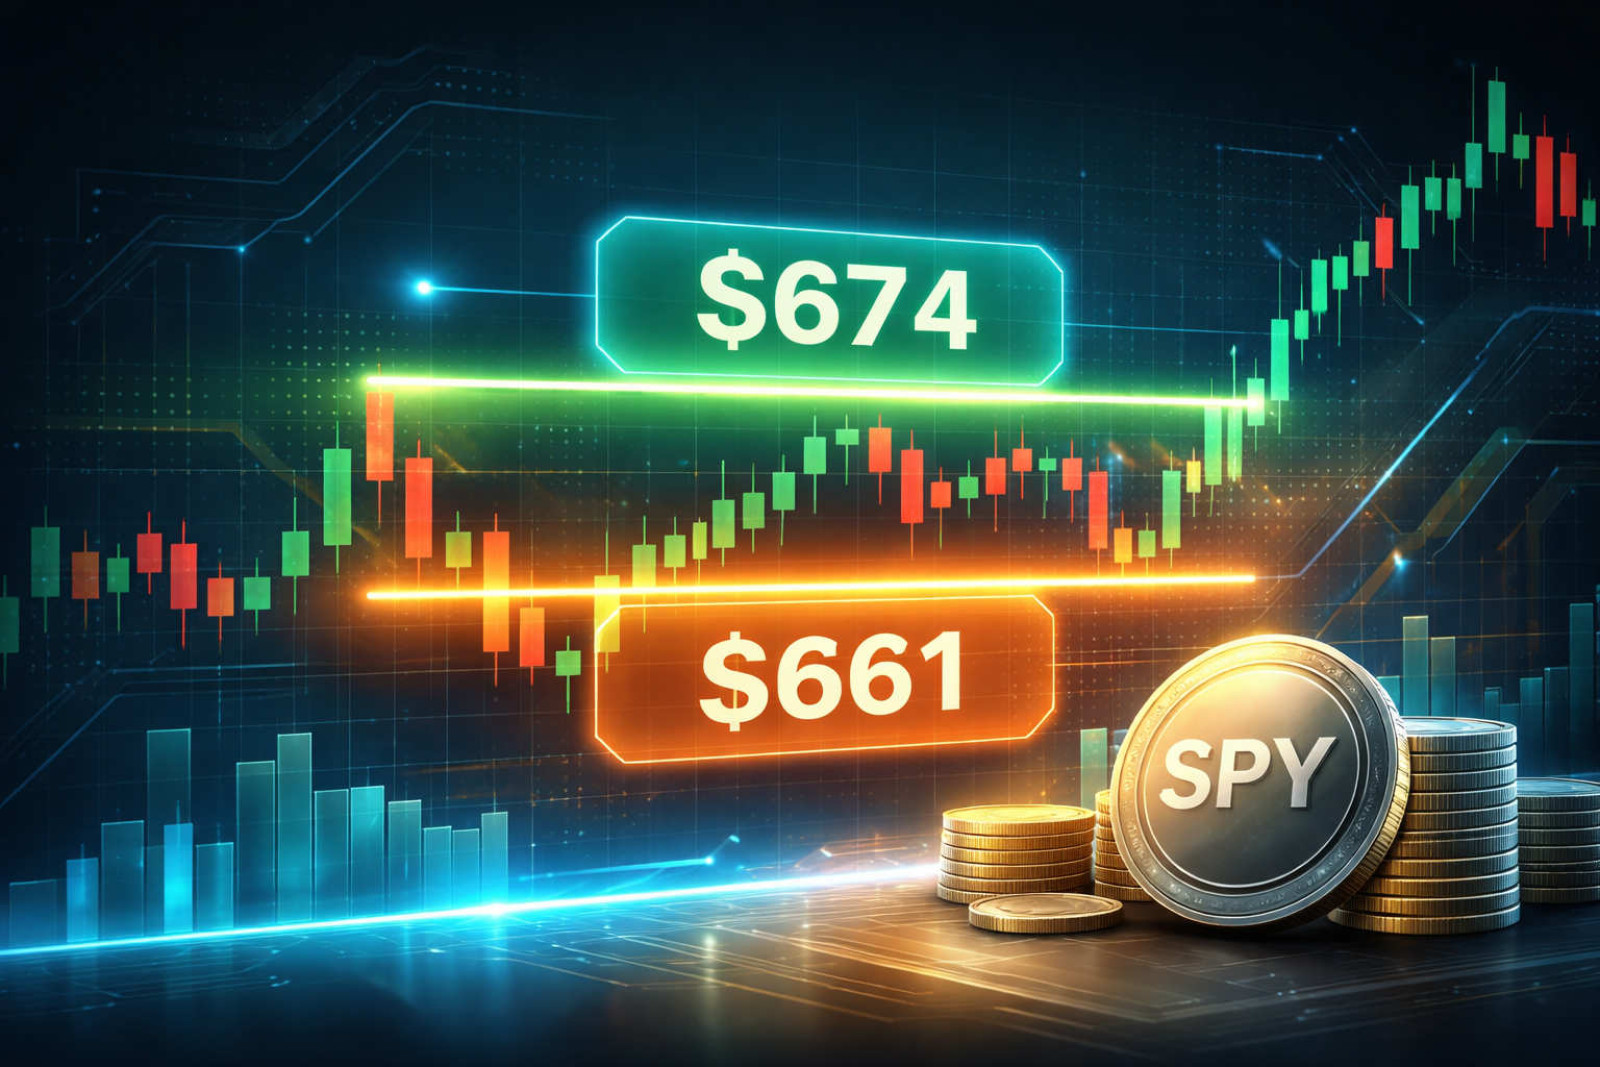
⬤ After the recent run-up, things got choppy near resistance. Candles are showing upper and lower wicks that basically reflect buyers and sellers going back and forth. Fibonacci retracement levels between roughly $674.60 and $661.30 mark the main reaction zone highlighted on the chart. Price is still trading above the deeper support around $651.36, so the broader structure hasn't broken down yet despite the recent pullbacks.
⬤ That highlighted rectangle marks where price consolidated before, and it's an area where reactions could happen again. The 0.618 retracement near $669.11 sits right in that zone and acts as a short-term reference for stability. A push back toward the upper boundary near $697.84 would show renewed strength, while a sustained drop below the mid-range could expose those lower retracement levels. Right now, price action looks compressed rather than ready for a big move either way.
⬤ This matters because SPY often reflects how the overall equity market is feeling. Holding above this retracement zone could help keep things stable across stock markets, while losing it might spike volatility and trigger broader repositioning. With price stuck between support and resistance, the next few sessions could shape near-term market momentum.
 Dmitri Lysenko


