 Dmitri Lysenko

⬤ The Russell 2000 just pushed into fresh all-time high territory on the weekly chart, smashing through the old peak around 2,460 and now trading near 2,700. This move shows buyers are still firmly in control and aren't backing down despite what the technicals might've been saying earlier.
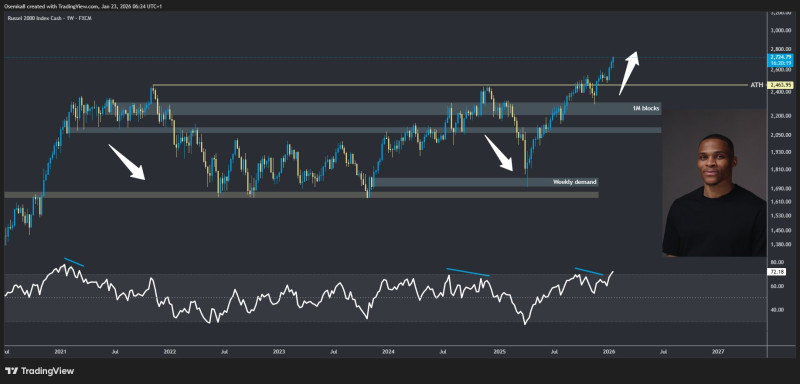
⬤ Here's what's happening on the chart: it's a textbook series of higher highs and higher lows. Every time the index pulls back, buyers show up at key support levels. When it dipped to around 1,700, demand kicked in. Same story when it retraced to 1,900—buyers stepped up again. These reactions created solid footing that let the Russell 2000 break through its old ceiling and keep running.
⬤ The technical picture backs this up too. Yeah, there were bearish divergences showing up on momentum indicators earlier, but they didn't lead to anything. No real selling followed. The weekly RSI is still elevated, which tells you demand's holding strong and sellers aren't getting much traction. Basically, every bearish setup got swallowed by buyers instead of triggering any meaningful reversal.
⬤ What this means for the broader market: when small-caps lead like this, it usually signals growing risk appetite and wider participation across stocks. If the Russell 2000 can hold above these former highs, that'll keep the positive vibes going. How it handles these levels moving forward will be key for gauging whether this trend's got legs or not.
 Dmitri Lysenko


