 Alex von Stachelkopf

⬤ The Nasdaq 100 Index has dropped toward the 24,000 level after struggling to maintain recent highs around 26,170. This horizontal support zone coincides with the long-term average, creating a technical inflection point where the index could either stabilize or continue lower.
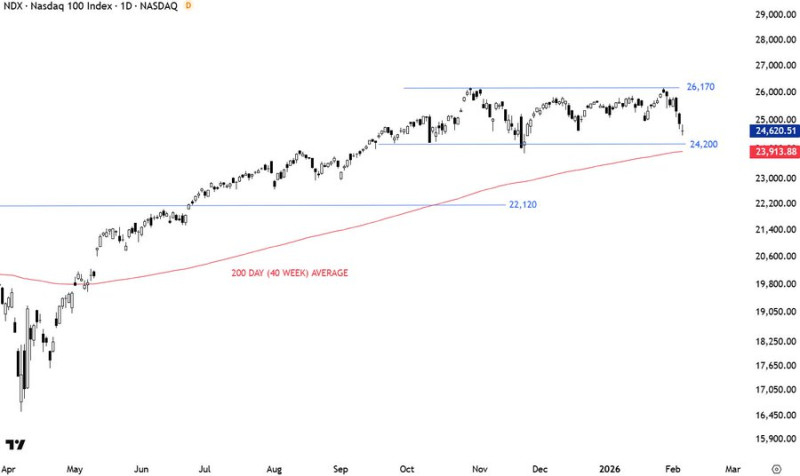
⬤ Looking at the daily chart, NDX previously bounced between 24,200 and 26,170 before pulling back. The decline brought prices back to the 200-day moving average near 23,900 to 24,000—a level that's historically served as a reliable trend reference during the broader rally.
⬤ The index extended above its long-term average during the recent rally and is now returning to test it. This places price back into the previous consolidation range, suggesting cooling momentum rather than a full trend reversal. Key support sits around 24,200, with deeper support visible near 22,120 if selling pressure continues.
⬤ How the index reacts around 24,000 will determine what happens next. If it stabilizes near this average, it would confirm a simple mean reversion move. But if it breaks below and stays there, traders should watch for a broader shift toward lower support zones and a potential change in the overall trend.
 Alex von Stachelkopf


