 Alex Bobrov

⬤ The NASDAQ 100 (US100) is basically trading sideways on the 1-hour chart after pulling back from its recent selloff. Price action's locked between 25,550 and 25,600, showing traders can't quite figure out which way to go next after that bounce.
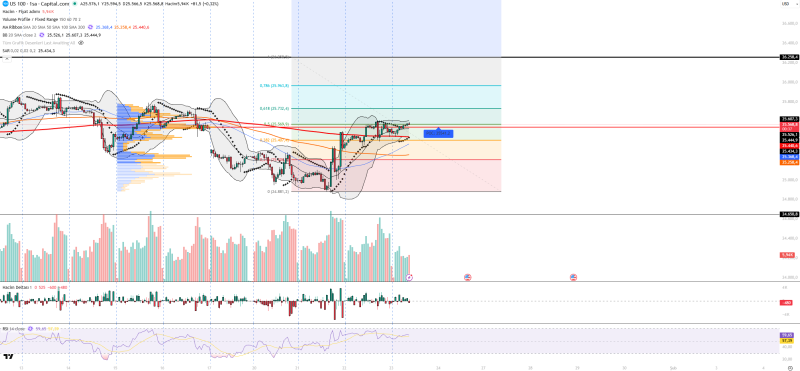
⬤ Here's what the chart's telling us: US100's sitting above short-term moving averages but can't push higher because there's heavy resistance lining up with VWAP overhead. Price keeps circling around the volume profile control point near 25,541—that's where most of the trading's been happening. This bunching up means buyers and sellers are pretty evenly matched right now, nobody's really winning.
⬤ The momentum picture backs up this range-bound vibe. RSI's hanging around 59, which is neutral-to-mildly-positive territory but nothing that screams "strong move coming." Volume's telling a story too—whenever price tries to push up, there's just not enough buying interest, and volume delta's negative, meaning sellers are stepping in to meet whatever buying shows up. Bollinger Bands have price near the middle line, confirming there's no real trend here, and Parabolic SAR dots are hugging price closely, showing weak directional conviction.
⬤ This consolidation phase reflects the broader wait-and-see mood across US equity indexes. Support's sitting around 25,444, 25,407, and 25,368, with resistance stacked near 25,607 and above. Until we see volume pick up or momentum shift, the NASDAQ 100's likely to keep bouncing around this range as traders position cautiously ahead of macro data and interest rate moves.
 Alex Bobrov


