
⬤ The US Dollar Index (DXY) is pushing higher right now, but it looks like just a corrective bounce rather than the start of something bigger. Technical analysts are watching the 99.5 level closely—if the rally can't break through there, it's probably going to fizzle out. The chart shows DXY trading in a resistance zone between 97.23 and 97.98 after dropping from higher levels earlier.
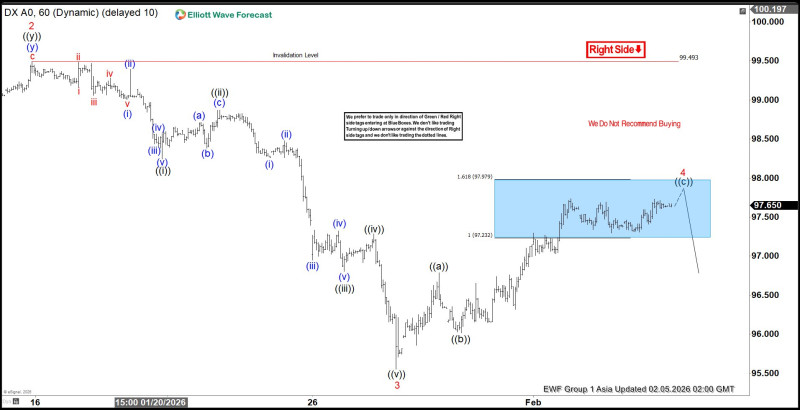
⬤ The wave pattern tells an interesting story: there was a clear downward move that finished, and now we're seeing a rebound phase. Price has moved into what traders call the "blue box" resistance area, which typically means this is a temporary recovery, not a full reversal. The key number to watch is 99.493—as long as DXY stays below that invalidation point, the bearish outlook stays on the table.
⬤ Here's the important part: buying isn't the smart move right now while price is stuck in this resistance zone. The expected path suggests the index will likely turn back down once this corrective pattern wraps up, which fits perfectly with how Elliott Wave corrections normally behave versus strong trending moves.
⬤ This matters beyond just the dollar itself. DXY movements ripple through commodities markets and global liquidity conditions, so traders across different asset classes are paying attention. If price gets rejected below 99.5, the corrective view holds and we'd expect further weakness. But if DXY punches through and holds above that level, all bets are off—that would flip the script and signal genuine strength returning to the dollar.


