 Alex Bobrov

⬤ Gold opened the week at a make-or-break technical level after tumbling from recent highs. Price is now testing the $4,987 zone following a steep retreat from the upper resistance area near $5,600. The daily chart reveals sharp volatility after months of steady gains, leaving traders watching closely to see which way momentum breaks.
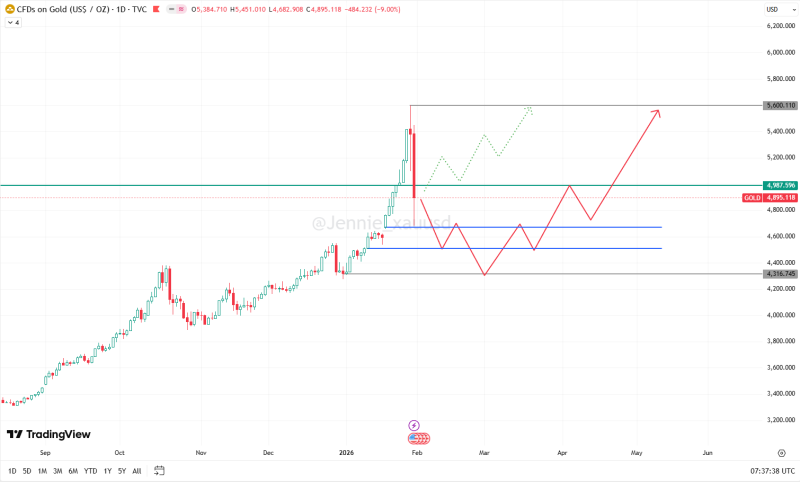
⬤ If gold pushes above $4,987 and holds, the uptrend likely resumes. The chart structure suggests consolidation could give way to another leg higher, bringing the $5,600 resistance zone back into play. The key isn't just breaking through—price needs to stay above this level to confirm bulls are back in control and the fluctuating upward trend continues.
⬤ A failure at $4,987 opens the door to extended downside. Multiple support levels sit below: first at $4,680, then $4,510, and finally the $4,316 area. These zones line up with prior consolidation points on the daily timeframe and represent places where selling could exhaust if the correction deepens.

⬤ This setup marks a potential shift from strong trending conditions into correction mode. The weekly chart shows early signs of trend exhaustion, raising the possibility that gold needs time to digest recent gains through sideways or downward movement. How price behaves around $4,987 will likely set the tone for the coming weeks—either stabilizing for another push higher or continuing the pullback before the next directional phase takes shape.
 Alex Bobrov


