 Tatiana Dementieva

⬤ Gold pulled back hard after hitting a major resistance area on the daily chart, showing strong selling pressure at higher levels. XAU couldn't hold momentum near the $5,400–$5,450 zone, which turned out to be a significant supply region rather than a breakout point. The rejection suggests a pause in the broader uptrend, not necessarily a full reversal.
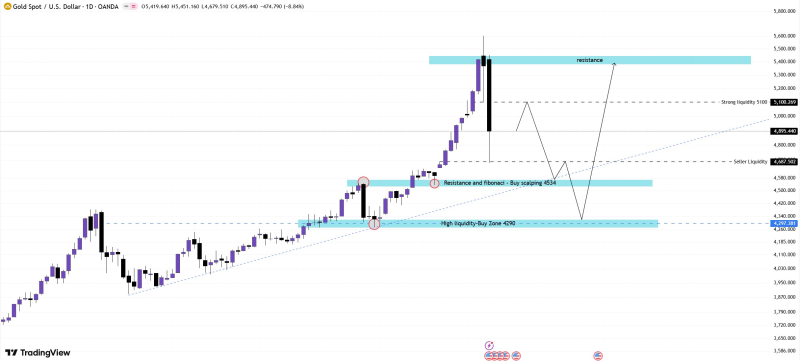
⬤ The daily chart reveals several high-impact liquidity areas that will likely shape where price heads next. That $5,400–$5,450 resistance band is acting as a pullback zone with heavy selling interest stacked above it. The chart shows a strong bearish reaction from this level, confirming sellers are defending it and capping any immediate upside.
These levels matter because XAU/USD is trading between clearly defined liquidity zones that can drive volatility and directional moves.
⬤ Market attention has now shifted to the $5,100 level, marked as a strong liquidity zone and key price magnet. This is a critical decision point for XAU—a clean break above or below could heavily influence the medium-term trend. If price loses support near $5,100, downside liquidity sits around $4,680–$4,700, where stop-loss orders and unfilled sell-side liquidity are concentrated, making it a notable downside target.
⬤ Below that, there's a high-liquidity buying area near $4,290, marking an important high-timeframe demand zone. A move into this region would signal a deeper corrective phase within the broader bullish cycle rather than a complete breakdown. This zone could act as a stabilization area if the pullback extends further, with price reactions around $5,100, $4,700, and $4,290 likely shaping market sentiment and determining whether gold resumes its upward cycle or enters deeper correction.
 Tatiana Dementieva


