 Edward Culchenko

⬤ Gold's daily chart is catching traders' eyes as XAU keeps climbing inside a rising formation. The current setup has people wondering whether we're seeing another wave extension take shape.
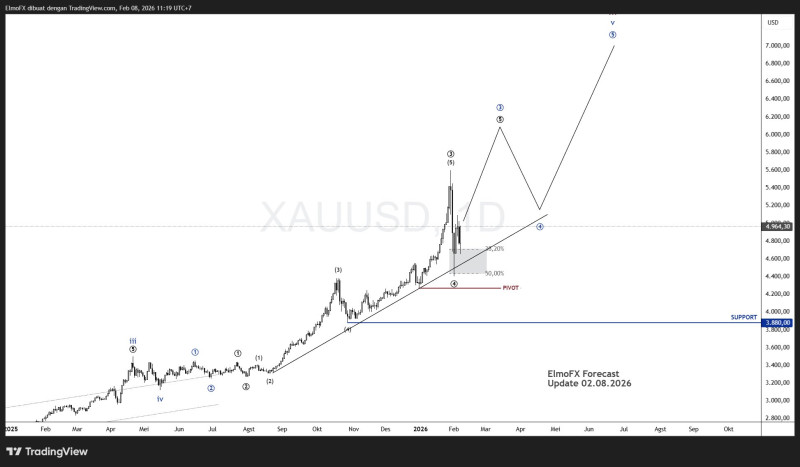
⬤ The chart reveals gold pushing higher along an upward trendline before pulling back, though it's staying above key retracement areas. Those zones sit around the 38.2% and 50% levels, with broader support marked near $3,880. Right now, price is holding above that support region.
⬤ Wave labeling hints at a possible continuation after this corrective dip. If the structure holds, we might see a temporary pullback before another leg up. That said, this is just one potential scenario—nothing's confirmed yet.
⬤ What happens at these levels matters. If gold holds the structure, the extension idea stays alive. Break below support, though, and the wave continuation gets thrown out, completely shifting the technical picture.
 Edward Culchenko


