 Alex Bobrov

⬤ Gold's recent price action turned heads after a dramatic weekly plunge—yet the metal managed to defend a crucial technical threshold. The yellow metal tumbled roughly 20 percent from last week's high to this week's low, it never broke below its 10-week moving average. That means we haven't seen confirmation of an intermediate-term top just yet.
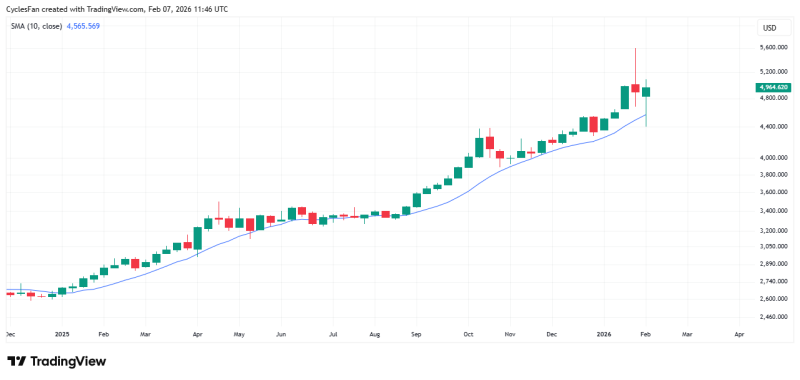
⬤ Looking at the chart, XAU has been climbing steadily through late 2025 and into early 2026, printing higher highs and higher lows the whole way. Even after this pullback, price is still sitting comfortably above that moving average, which currently runs somewhere around the mid-4500 zone. Similar pullback behavior is covered in Gold forecast and technical analysis for XAU/USD.
⬤ The drop came right after a powerful rally that pushed gold close to record territory before running out of steam. Here's the key part: "Because price remains above the 10 week average, the trend structure remains intact and allows the possibility of new highs into late April under the current cycle," according to the cycle analysis. That's a big deal for anyone watching where gold goes next. More on these corrective moves can be found in Gold price outlook: correction within an uptrend and XAU/USD weekly technical review.
⬤ As long as gold keeps trading above that moving average, the overall directional framework stays in play. The trend only flips if price actually breaks and holds below that line—something it hasn't done yet.
⬤ Beyond the technicals, macro forces are at work too. Gold tends to move in sync with shifts in the US dollar and safe-haven demand. When the dollar strengthens, it usually puts temporary pressure on gold prices. When uncertainty kicks back in, buyers return to bullion. That dynamic helps explain the recent volatility alongside what we're seeing on the charts.
 Alex Bobrov


