 Dmitri Lysenko

⬤ Gold just posted a historic breakout on the weekly timeframe, clearing a resistance level that had held price down for nearly eight years. The XAU/USD chart shows gold finally emerging from a long-term structural formation and accelerating sharply higher after the breakout—a key technical shift for the broader market.
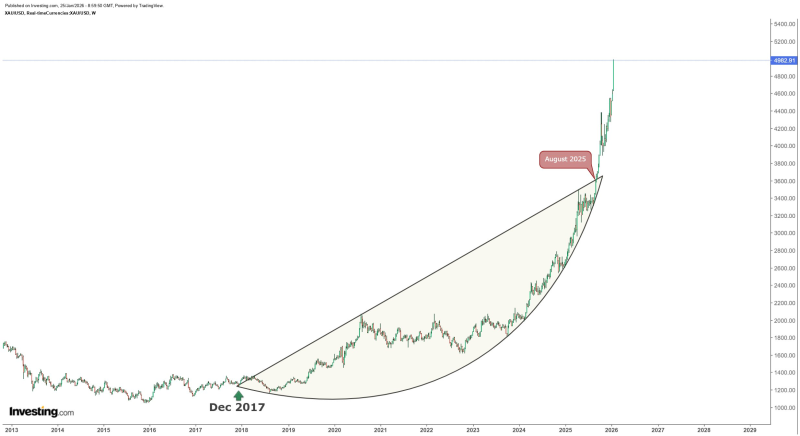
⬤ The decisive breakout happened in August 2025. The chart shows a rounded, multi-year base that started forming near the December 2017 lows, followed by a gradual climb. After testing the upper boundary of this structure repeatedly, gold finally pushed through resistance and triggered a strong upside move instead of just a brief spike.
⬤ Weekly price action after the breakout shows increasing momentum, with consecutive strong candles pushing gold rapidly higher. This looks like sustained trend participation rather than short-term noise. Once that eight-year resistance broke, price expanded vertically, confirming the breakout and reinforcing the strength of the uptrend.
⬤ This move matters for the broader market because long-term resistance breaks often reshape trend expectations and sentiment across asset classes. Gold is closely watched as a macro-sensitive asset, and a confirmed weekly breakout of this size can shift positioning in commodities, currencies, and related markets. The sharp acceleration after the breakout shows why monitoring momentum is critical as gold moves into this new price territory.
 Dmitri Lysenko


