 Tatsiana Ketrar

⬤ Australia's inflation story is getting complicated as administered prices keep running hot compared to market-based inflation. The chart shows administered inflation sitting at roughly 7.55% year over year, while market goods and services (excluding volatile items) are tracking around 2.58%. This split stands out because most developed economies are either holding rates steady or cutting them, but Australia's dealing with a different problem entirely.
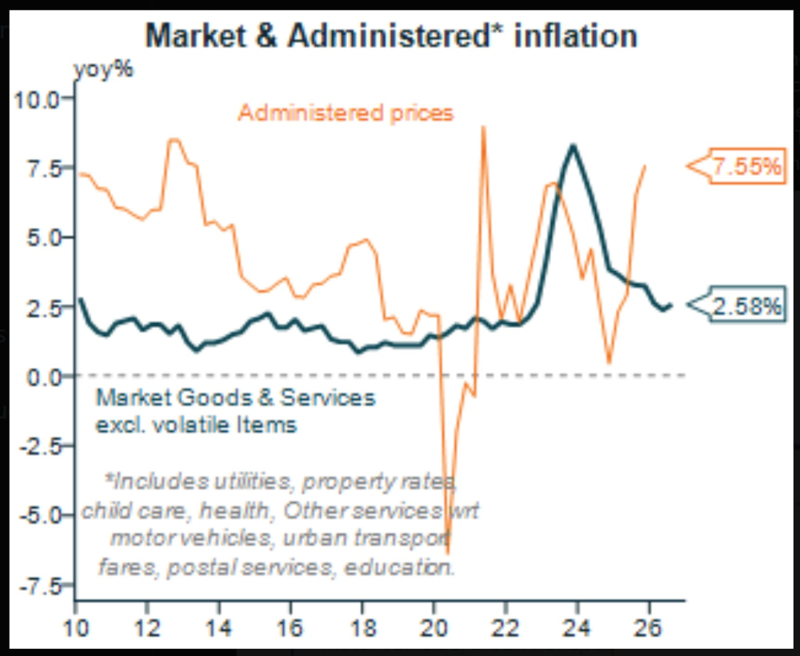
⬤ The chart makes the growing gap between government-influenced costs and market prices crystal clear. Administered prices cover utilities, property rates, childcare, healthcare, education, transport fares, and other regulated services. These categories have stayed stubbornly high since the 2022 post-pandemic inflation peak, with barely any sustained cooling. Meanwhile, market inflation has trended down and settled near levels that align with central bank targets.
⬤ This imbalance hits households hard because administered costs are unavoidable and don't respond much to consumer behavior changes. The chart also shows administered inflation has been more volatile—swinging sharply before bouncing back to high levels—while market inflation followed a steadier, more controlled path. This structural difference limits what monetary policy can actually do, since rate changes barely touch prices that governments set or heavily influence.
⬤ For markets, this matters because persistent administered inflation keeps overall price pressure elevated, making higher interest rates in Australia more likely compared to global peers. These stubborn regulated costs will likely keep influencing policy expectations, currency moves, and economic sentiment. As Australia deals with cooling market inflation but sticky administered prices, the tension between fiscal decisions, monetary policy, and cost-of-living pressures will stay front and center.
 Tatsiana Ketrar


