
⬤ GBP/USD just delivered one hell of a move, jumping more than 100 pips after finally breaking free from a descending trendline that'd been holding it down. The pair spent weeks coiling up in a tight range before exploding higher on the four-hour chart.
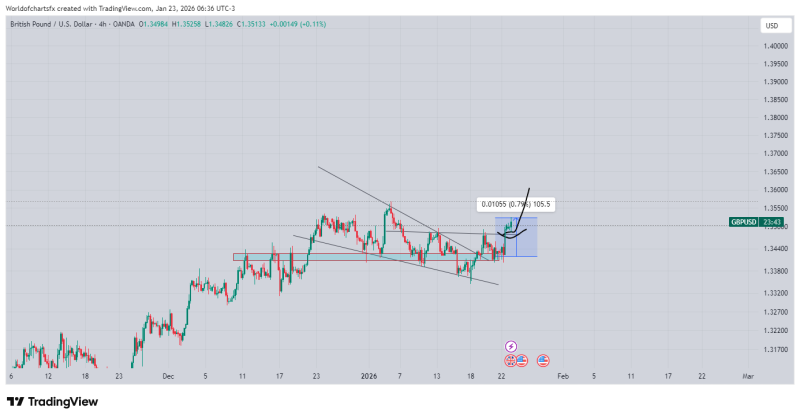
⬤ Here's what happened: price had been bumping its head against a downward sloping resistance line throughout early January. But it never gave up the 1.34 support zone underneath—that's where buyers kept stepping in. Once that resistance finally cracked, the pound didn't mess around. It shot straight up into the mid-1.35s, proving this wasn't just a fake-out.
⬤ The technical picture tells you everything you need to know. We're seeing higher lows stack up nicely, momentum building steadily—this isn't some random volatility spike. The chart shows a clean 0.7-0.8% gain, which lines up perfectly with that 100+ pip move. And yeah, the old resistance is now flipping into support, which is exactly what you want to see.
⬤ This breakout matters because GBP/USD is one of those pairs everyone's got their eyes on, especially when macro expectations start shifting. The move was orderly, technical, and well-executed. Now the big question is whether the pound can hold above this breakout zone and keep the momentum going, or if we're about to see some profit-taking that brings it back down to test support.


