
⬤ The British pound weakened against the dollar and dropped into a support zone that traders had marked in advance. GBP/USD hit the blue box area right where analysts expected, creating a clear reaction point that fits with Elliott Wave patterns. The decline looks like a normal pullback rather than the start of a bigger downtrend.
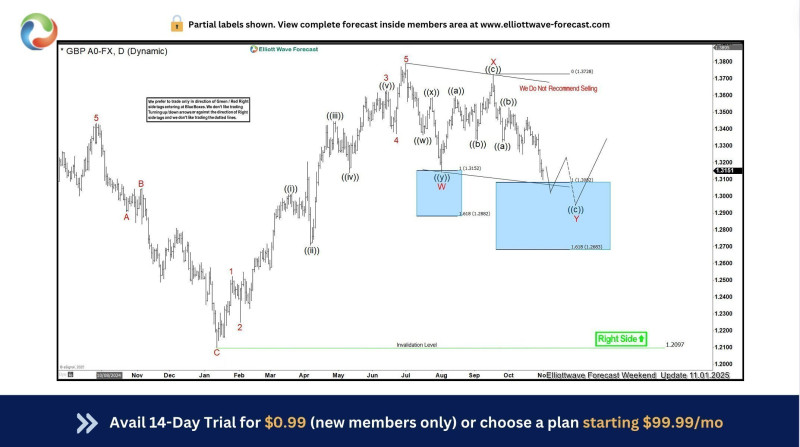
⬤ The chart shows GBP/USD falling from around 1.37 down to the 1.29-1.31 range. The support zone was drawn using Fibonacci extensions, with the bottom edge near 1.2683 at the 1.618 level and the top closer to 1.31. Price moved into this area after forming lower highs and lower lows in a steady, organized way—more like a correction than a sharp breakdown.
⬤ Elliott Wave analysis labels this drop as wave Y inside a larger corrective structure. The price action before this showed several smaller internal waves, followed by the current pullback into the highlighted zone. The chart also sketches out possible paths forward once this correction wraps up, with a clear invalidation level marked well below to define the technical boundary.
⬤ Reaching this support zone matters because these predefined areas often influence how GBP/USD behaves in the short term. When price hits spots like this, it can shift trader sentiment and volatility quickly. What happens next around 1.29 could show whether the pair stabilizes here or keeps correcting, which would affect expectations across major currency markets.


