
⬤ GBP/USD dropped into a predefined support region before stabilizing and pushing back up. The pullback hit the blue box area and created a clear swing buying opportunity. The bounce happened right inside the projected demand zone marked on the chart.
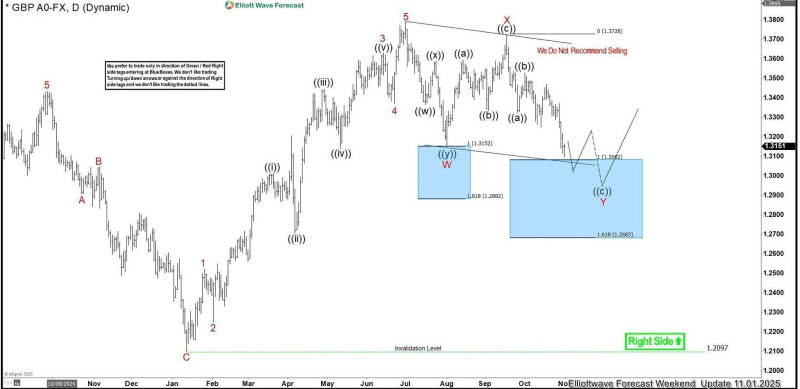
⬤ The chart shows GBP/USD falling from a peak near 1.37 into a corrective pattern labeled W and Y. Price entered the blue box support zone around 1.28 to 1.31, which lines up with an Elliott Wave corrective completion area and Fibonacci extension levels. After touching this zone, the pair held above the invalidation level near 1.2097 and started climbing, confirming that buyers stepped in at the projected support.
⬤ The move followed a completed five-wave rally and shifted into a complex correction. The decline played out in multiple legs before reaching the highlighted accumulation zone. The projected path suggests the correction likely finished wave C within the larger structure, setting up the market to resume its upward move from support instead of dropping further.
⬤ The bounce at the blue box shows how structured wave analysis spots potential turning points during corrections. GBP/USD respecting the support zone reinforces how predefined technical areas can guide price behavior and keep the broader uptrend intact after a pullback.


