 Yuriy Ukazkin

⬤ GBP/AUD is trading within a clear bearish structure on the 4-hour chart following an extended decline. Price action shows repeated breaks below rising channels and previous support areas, confirming that sellers remain in control. The recent selloff pushed the pair into a marked demand zone just below 1.9720, where a short-term reaction has begun to form. Still, any upside movement here looks more like a correction than an actual trend reversal.
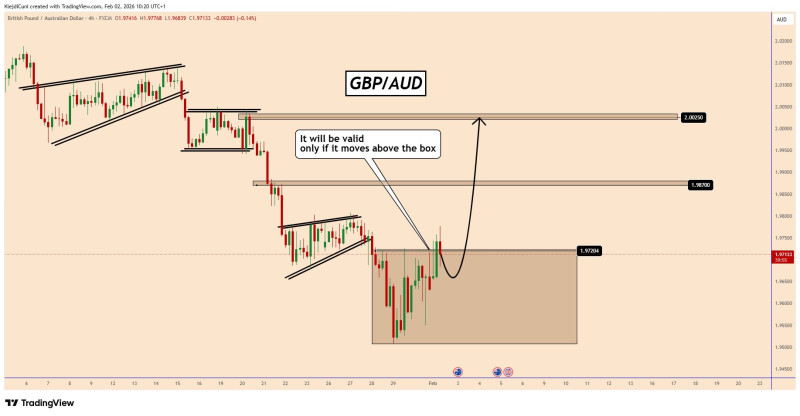
⬤ The chart shows price bouncing off the demand box located beneath 1.9720, which has temporarily slowed selling pressure and allowed for a modest recovery. But the pair remains stuck below a well-defined supply area, keeping the overall bearish structure in place. Previous attempts to rally have consistently failed below this zone, proving it's where sellers keep stepping back in.
⬤ A bullish scenario only becomes realistic if GBP/AUD breaks above the highlighted box and reclaims the 1.9720 to 1.9870 range. This area used to be support but has now flipped into resistance after the recent breakdown. Until price can hold above this zone, any bounces remain countertrend moves. If buyers can't defend the current demand area, the chart suggests the pair could drop even further before finding a more solid base.
⬤ This setup matters because GBP/AUD often reflects shifts in relative strength between the British pound and the Australian dollar. Clear bearish structures combined with conditional rebound scenarios can drive short-term volatility and shape directional expectations. With the pair trading near a critical decision area, how price behaves around these key levels will likely determine whether the downtrend continues or shifts into consolidation.
 Yuriy Ukazkin


