 Alex Borzak

⬤ GBP/AUD pulled back after its recent bounce ran into a key resistance zone highlighted on the chart. The pair climbed into the blue box area last week, where it hit a wall of selling pressure. Once price entered this zone, buyers lost control and the pair started heading south again.
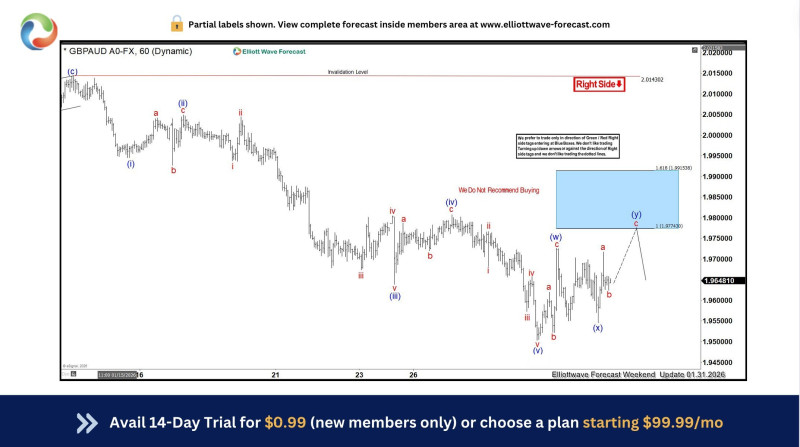
⬤ The chart shows a broader corrective pattern, with the blue box marking a zone where price has reacted before. After dropping earlier, GBP/AUD rallied back toward this resistance region. But once it reached the blue box, momentum faded fast and the bounce ran out of steam, triggering fresh downside action.
⬤ The wave structure suggests the move into the blue box was just a corrective bounce, not a trend reversal. After getting rejected from this area, GBP/AUD resumed its decline, staying in line with the technical setup shown on the chart. The reaction at this resistance level confirms its significance in the current price structure.
⬤ This matters because GBP/AUD keeps respecting well-defined technical zones during volatile periods. When price gets rejected from established resistance areas, it shapes near-term direction and shows where the real market players are positioned. How the pair moves after this pullback will be key for understanding where it's headed next as forex market conditions continue to shift.
 Alex Borzak


