 Helena Izotova

⬤ Natural gas has been trading in a well-defined channel marked by two major trend lines throughout 2024 and into 2025. The price keeps getting rejected at the upper red resistance line around $4 while finding solid support at the lower green line near $2.50.
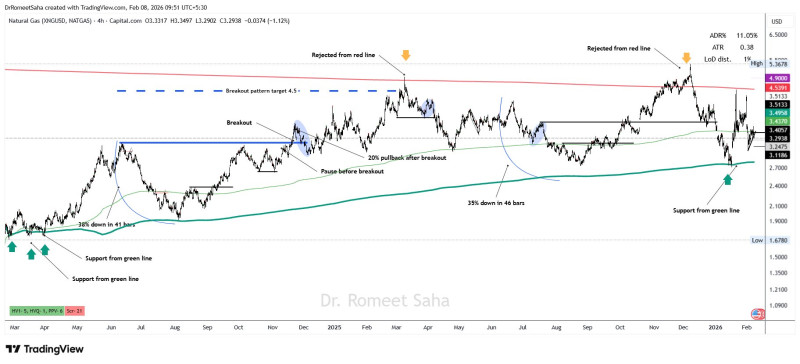
⬤ The pattern is clear on the charts – every time gas prices rally toward the top boundary, they get pushed back down. And whenever they drop toward the bottom line, buyers step in and push prices higher again. What's interesting is that these swings are getting smaller and smaller, creating a tightening wedge formation.
⬤ Past price movements show consistent pullbacks after hitting either boundary, with the most recent action showing another bounce off the green support line. This same back-and-forth behavior has played out several times now, confirming that both trend lines are still very much in play.
⬤ With the range narrowing between roughly $2.50 and $4, natural gas is approaching a decision point. The shrinking space between these trend lines suggests a bigger move is coming soon – either a breakout above resistance or a breakdown below support will likely determine the next major direction for natural gas prices.
 Helena Izotova


