
⬤ Natural gas is trading at a make-or-break zone right now. The daily chart shows price stalling after a solid move higher, with recent candles forming tight patterns near the upper end of the range. After breaking out of a downward channel, the market has gone sideways instead of continuing the rally. Small candles and inside bars signal indecision rather than a clear trend in either direction.
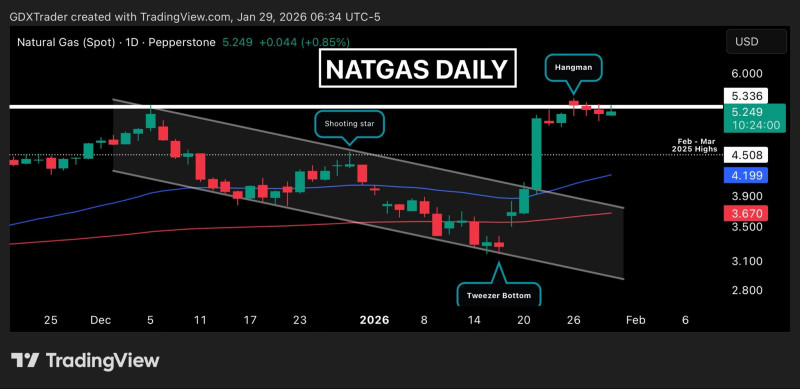
⬤ There's a decent case for this being a bull flag in progress. The recent strength is getting digested through consolidation, which is pretty normal after a sharp move. Sellers haven't been able to push price down meaningfully, suggesting buyers are still defending the level. As one trader noted, "price action shows no clear directional control, placing NATGAS at an inflection point."
⬤ But there's also downside risk here. Earlier price action formed three red candles in a row—a pattern that usually warns of potential weakness. While the market bounced hard from the channel's lower boundary, buying pressure has faded near resistance. Neither side is winning right now, which creates this compressed, range-bound environment.
⬤ This setup matters because consolidation zones like this often lead to sharp moves once they break. With both bulls and bears sitting on their hands, the market is coiled and waiting for a catalyst. How this compression resolves will likely decide whether natural gas pushes higher or rolls over into a pullback.


