
⬤ EUR/USD is under steady selling pressure on the four-hour timeframe, with price structure clearly pointing to further downside. The chart shows a sustained bearish move after rejection from higher levels, as momentum shifted decisively lower. The current focus is on how price interacts with internal range liquidity and the external range liquidity zone within the broader intraday structure.
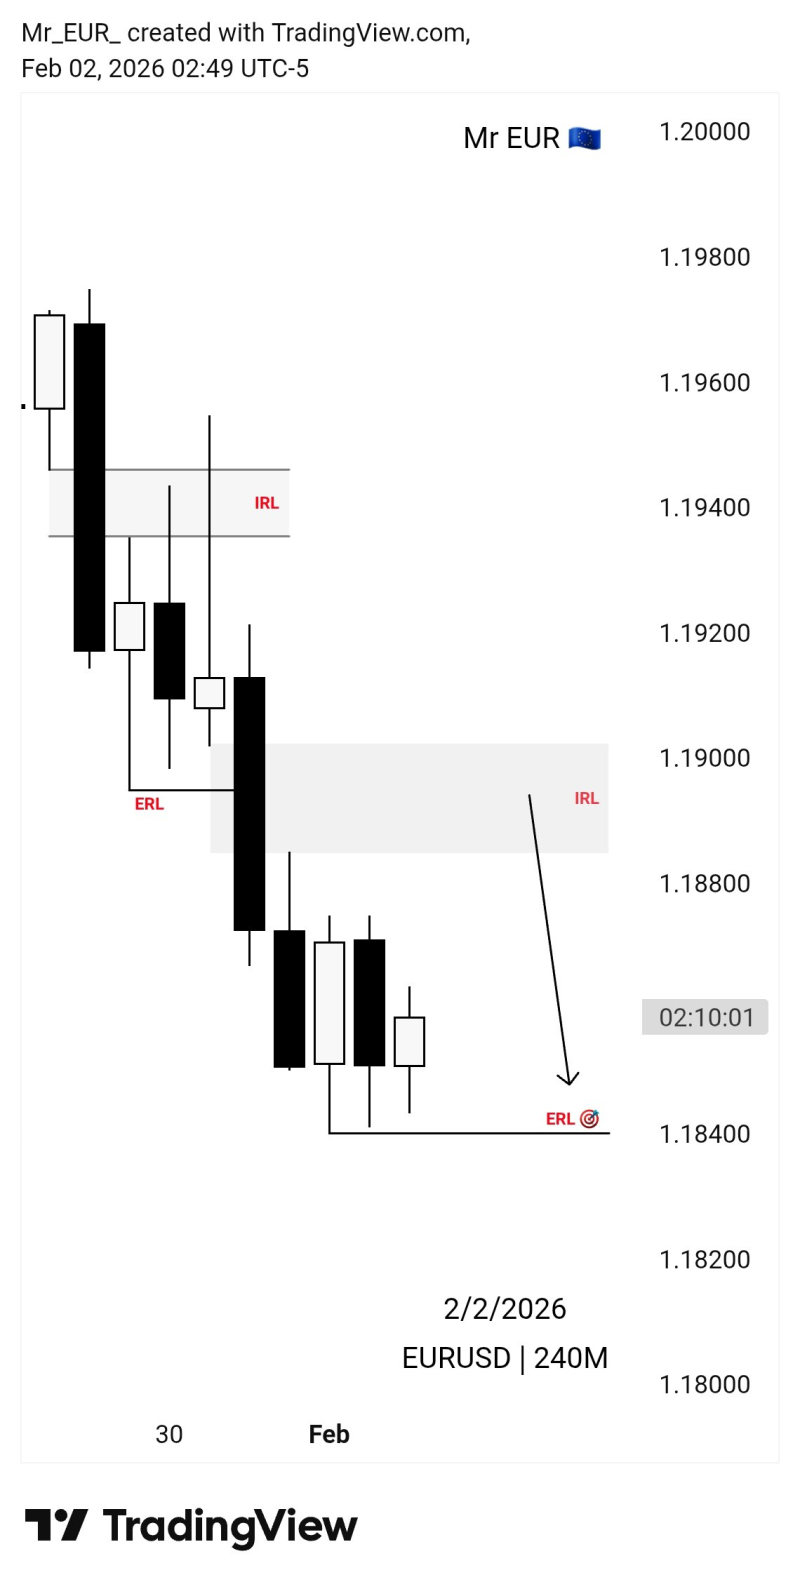
⬤ The chart shows EUR/USD getting rejected from an internal liquidity zone near 1.194 to 1.195. After that rejection, the pair couldn't find support and printed back-to-back bearish candles, confirming sellers were firmly in control. A secondary internal liquidity zone around 1.189 to 1.190 also failed to stop the decline, reinforcing the bearish momentum. The move lower came with minimal upside pullbacks, showing persistent selling rather than just a correction.
⬤ Price has now moved toward the external range liquidity level near 1.184, which is marked on the chart as the downside target. This level lines up with the lower edge of the recent trading range and represents an area where liquidity built up previously. The structure doesn't show signs of a reversal setup yet—it looks more like continuation toward that external liquidity zone. The lack of strong bullish candles near current levels suggests downside momentum is still intact.

⬤ This matters because EUR/USD drives major moves across global forex markets. A push toward external range liquidity reflects sustained directional pressure and can shift sentiment across other major pairs. As EUR/USD approaches the 1.184 zone, how price reacts there could shape near-term volatility and determine whether the selloff extends or transitions into consolidation.


