
⬤ The pound is bouncing back against the dollar right now, with the 30-minute chart showing GBP/USD climbing back into an important resistance area. The pair is recovering from recent lows but still stuck inside a larger bearish setup. This looks like a pullback into resistance rather than the start of something bullish.
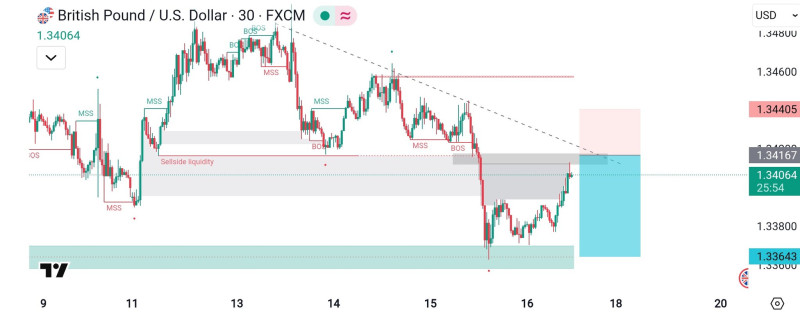
⬤ The chart shows GBP/USD trading below a descending trendline that's been keeping price down during the recent drop. The rebound has pushed the pair back toward the 1.3415–1.3445 zone, which is marked as key resistance. This zone lines up with a previous structure break and a supply area, making it technically significant. Price has struggled here before, which means sellers could show up again around these levels.
⬤ While recent candles show some short-term buying interest, the bigger picture still looks bearish. The chart continues to show multiple structure shifts pointing downward. If price gets rejected from the 1.3415–1.3445 resistance zone, the next targets would be 1.3380 and possibly 1.3365 if selling picks up again.
⬤ This matters because it helps separate temporary bounces from actual trend reversals. Pullbacks into old supply zones usually decide whether a trend keeps going or starts to weaken. How price behaves around this resistance band will shape what happens next for the pound in the short term.