 Tatiana Dementieva
This is the first article by the Faculty for Futures Trade and Stock Exchange within the Masterforex-V Trading Academy that deals with a relatively new method of reading the market that has already won some popularity and is called Price Action.
The term itself, Price Action (PA), can be interpreted as price movement or price change.
So, it follows from the name itself that PA is about finding out the change and interaction between three market factors such as price, time and volume. PA methods are primarily focused on the price, the most important market measure.
By knowing and understanding what PA methods are about, you can learn to read the market as well as professional analysts. This ability can turn the market into an open book for you where you can single out not only the current phase the market is in now, but also the general balance of powers: who is stronger — the buyers or the sellers (bulls or bears).
Essentially, the PA method helps define such sections in the price chart where there is a good likelihood a rally (a strong move in one direction) will start.
When looking at a price chart of any instrument, it becomes obvious that it is made up of tops and bottoms that trends are made up of. Every next top is above the previous bottom in a rising trend.
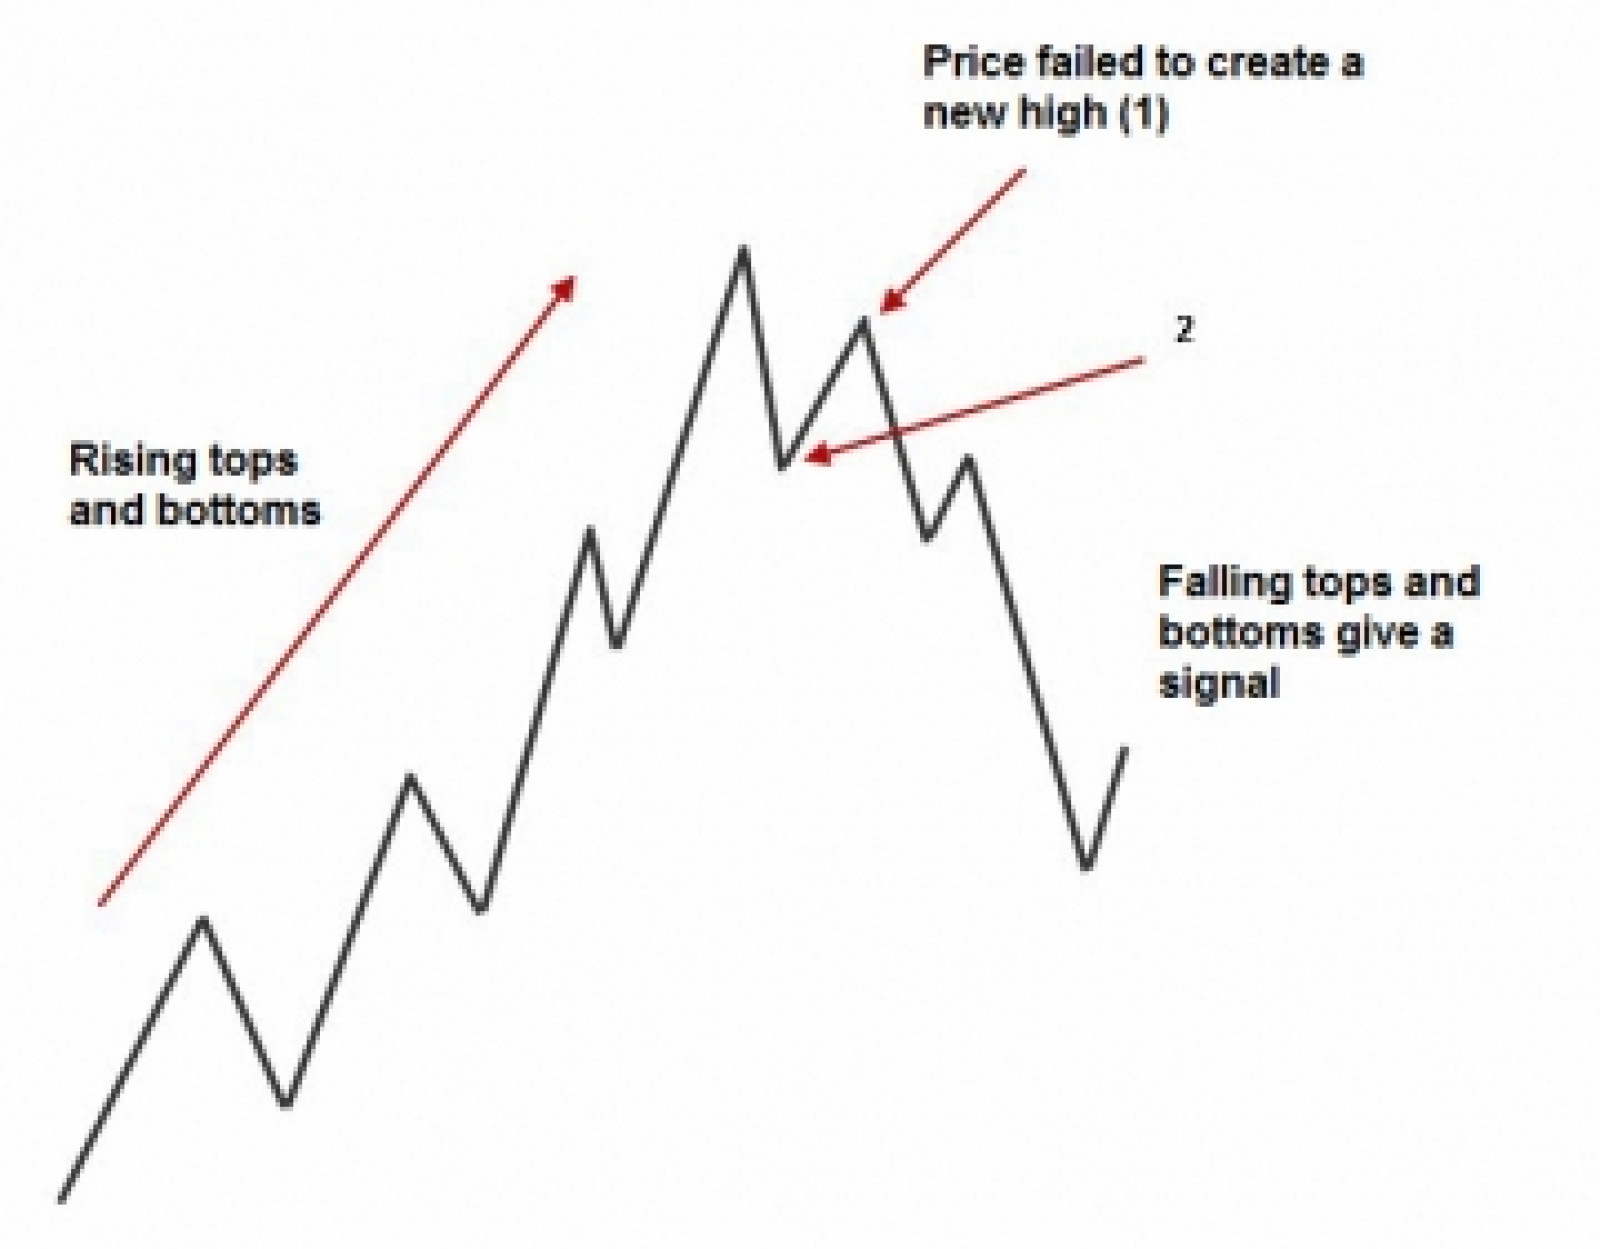
Here, the trend reverses in a situation when rising tops and bottoms are replaced by falling ones:

In this illustration, you can see rising tops and bottoms, but the top is below the previous one in Pint 1. Later the price crosses Point 2, the previous bottom. In this event, one can say the trend has turned into a downtrend.

The picture is opposite in a downtrend where there is a series of falling tops and bottoms. However, when the price goes below the previous bottom (Point 3) and starts rising above the previous top (Point 4), we can suppose the trend changed again, this time to an uptrend.
This is the kind of trend reversal we can speak of when the price is at Point 5. Then we see further alteration of rising tops and bottoms.

What you can see above is a PA sample of BAC shares. There was a series of falling tops and bottoms in November-December 2008 and in January 2009.
That the downtrend was over was signaled by the broken top in early March 2009 followed by a trend reversal from falling to rising and a series of rising tops and bottoms. There was a narrow-ranging consolidation in June and July. The breakout of the consolidation pattern and movement coupled with rising tops and bottoms signaled continuation of the uptrend.
Of course, it isn't as simple as it might seem at first sight. But this is really a very convenient and simple tool that can significantly improve the quality of trading.
Price Action is derived from Wyckoff Method and, as such, is related to VSA (Volume Spread Analysis).
Unlike VSA, however, that compares the price spread to each bar's volume, PA is fully focused on learning the behavior or price movement in different market phases. Volumes are also taken into consideration when analyzing price movement, but only as a confirmation in case of price change.
Please remember that PA methods are universal and work equally well for all traded instruments and all timeframes. The PA method allows trading a clean chart and a combination of different technical indicators that are usually used in ways other than standard ones.
Many PA followers are convinced that the price itself shows its further direction, and one needs no other secondary techniques (even though, as we checked out, some indicators can really help in decision-making. But they are not from the oscillator class).
When looking at main PA patterns, we singled out main ones and saw that the others are only a variation on the main theme. PA can be used on both the candlestick and bar chart. The most important thing is the ability to determine price patterns and know how to use them.
Of course, this method is part of technical analysis, and many proponents of fundamental analysis treat it skeptically.
However, the most interesting developments from the Faculty for Futures Trade and Stock Exchange help define reversal points and the start of new tendencies in the market by using not only graphical information, but also original methods of analysis of market information provided by stock exchanges and brokers in the form of various reports and constantly incoming information about trading activity on trading floors.
It is this information combined with technical patterns that helps us to define most accurately changes in the sentiment and open trades of major funds and investors that shape the start of market movement and join the 'right' side of this movement in a timely manner.
 Tatiana Dementieva


